

In this video· click a step to jump to it
Test recording
How's the Stack — app walkthrough
71,120 ms · 19,935 pixels changed
We built this regression test for howsthestack.com — it's yours to keep, free.
Take this test with you
This is a real Playwright test, recorded against howsthestack.com. Claim it into your own workspace and re-run it on every deploy — free.
export async function test(page, baseUrl, screenshotPath, stepLogger) {
  const shot = (i, slug) => screenshotPath.replace('.png', '-' + i + '-' + slug + '.png');
  const SCROLL_THROUGH = "(async () => { const ease = t => 1 - Math.pow(1 - t, 3); const max = Math.max(0, document.body.scrollHeight - window.innerHeight); if (max < 40) return; const anim = (a, b, ms) => new Promise(res => { const t0 = performance.now(); const step = now => { const p = Math.min(1, (now - t0) / ms); window.scrollTo(0, a + (b - a) * ease(p)); p < 1 ? requestAnimationFrame(step) : res(); }; requestAnimationFrame(step); }); await anim(0, max, 1200); await new Promise(r => setTimeout(r, 250)); await anim(max, 0, 700); })()";
  const SITE = 'https://howsthestack.com';
  const STAMP = Date.now().toString(36);

  for (const pattern of ['**/googletagmanager.com/**', '**/google-analytics.com/**', '**/*.posthog.com/**']) {
    await page.route(pattern, function (r) { r.abort(); }).catch(function () {});
  }

  // ── POST-LOGIN ACTION 1: the signed-in Overview / product pulse ──
stepLogger.log('Post-login 1: overview');Checks run
Notes from the demo run
AI-generatedWe signed into How's the Stack with Google, drove the Overview pulse across its Today / 7d / 30d windows, walked the integrations catalogue on /profile, and filed and upvoted an integration request. The product has an unusually clear point of view: one screen that answers 'what is happening across my product right now', with integrations as tabs rather than as a settings maze. The thing holding the demo back is that the empty state has nothing to show.
- One-line product thesis, executed'What is happening across your product right now' with a single Overview and integrations-as-tabs is a sharper framing than the dashboard-builder approach most of this category takes.
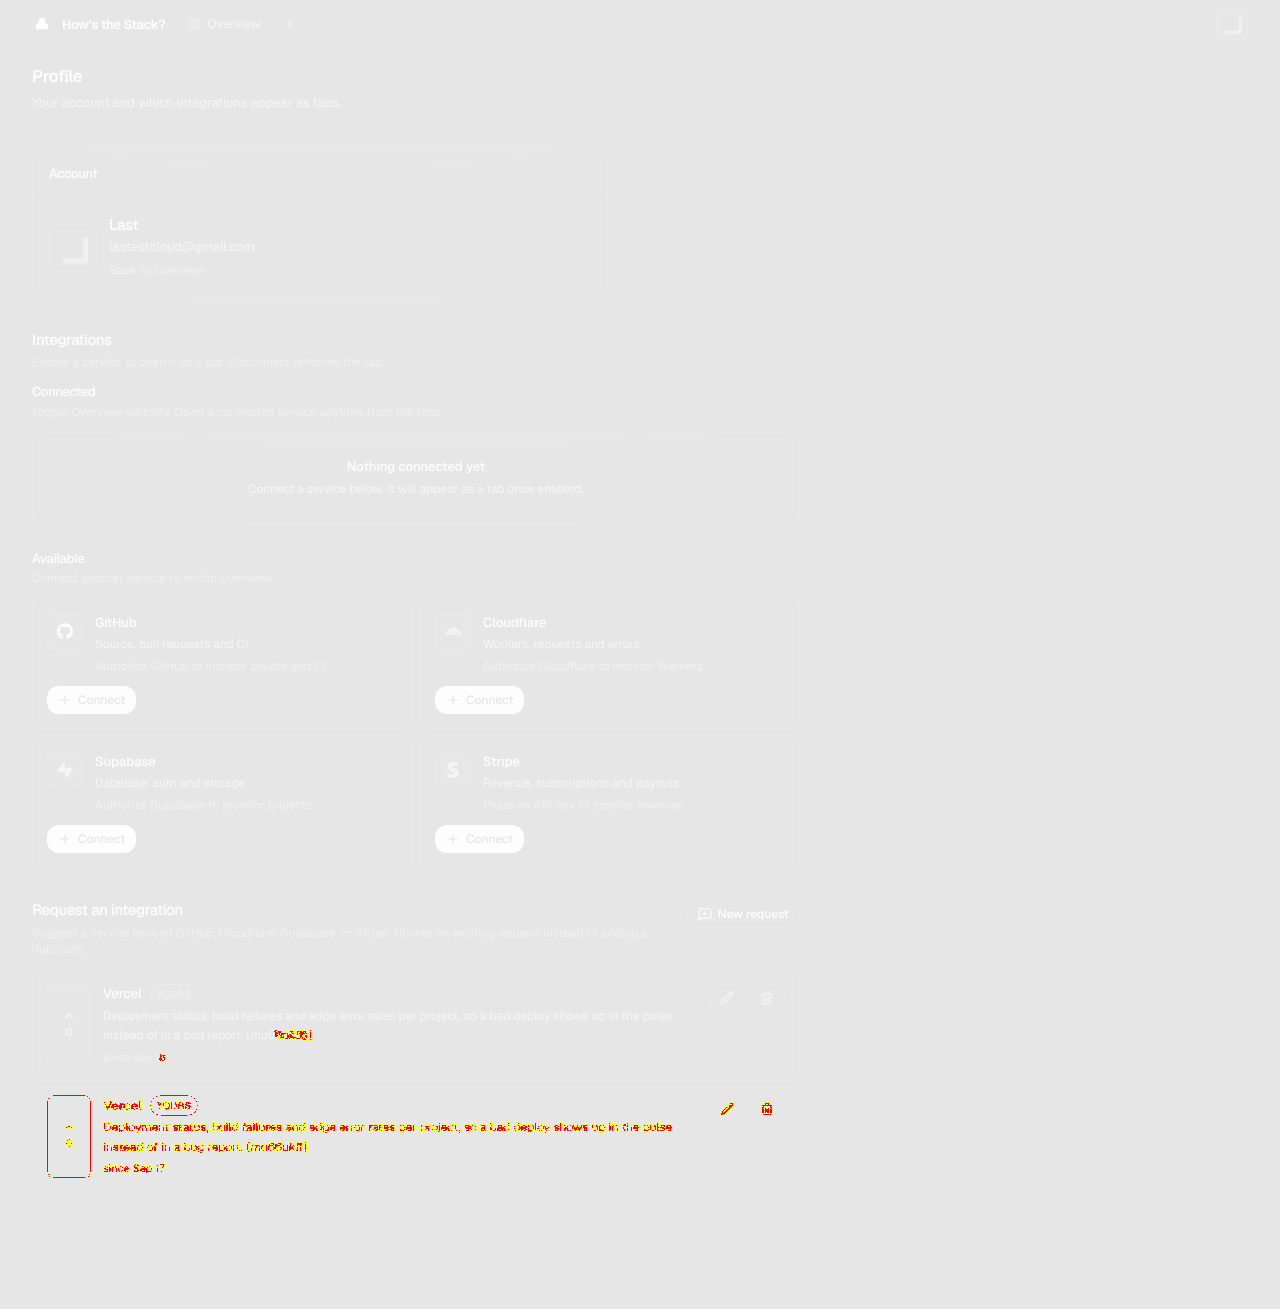
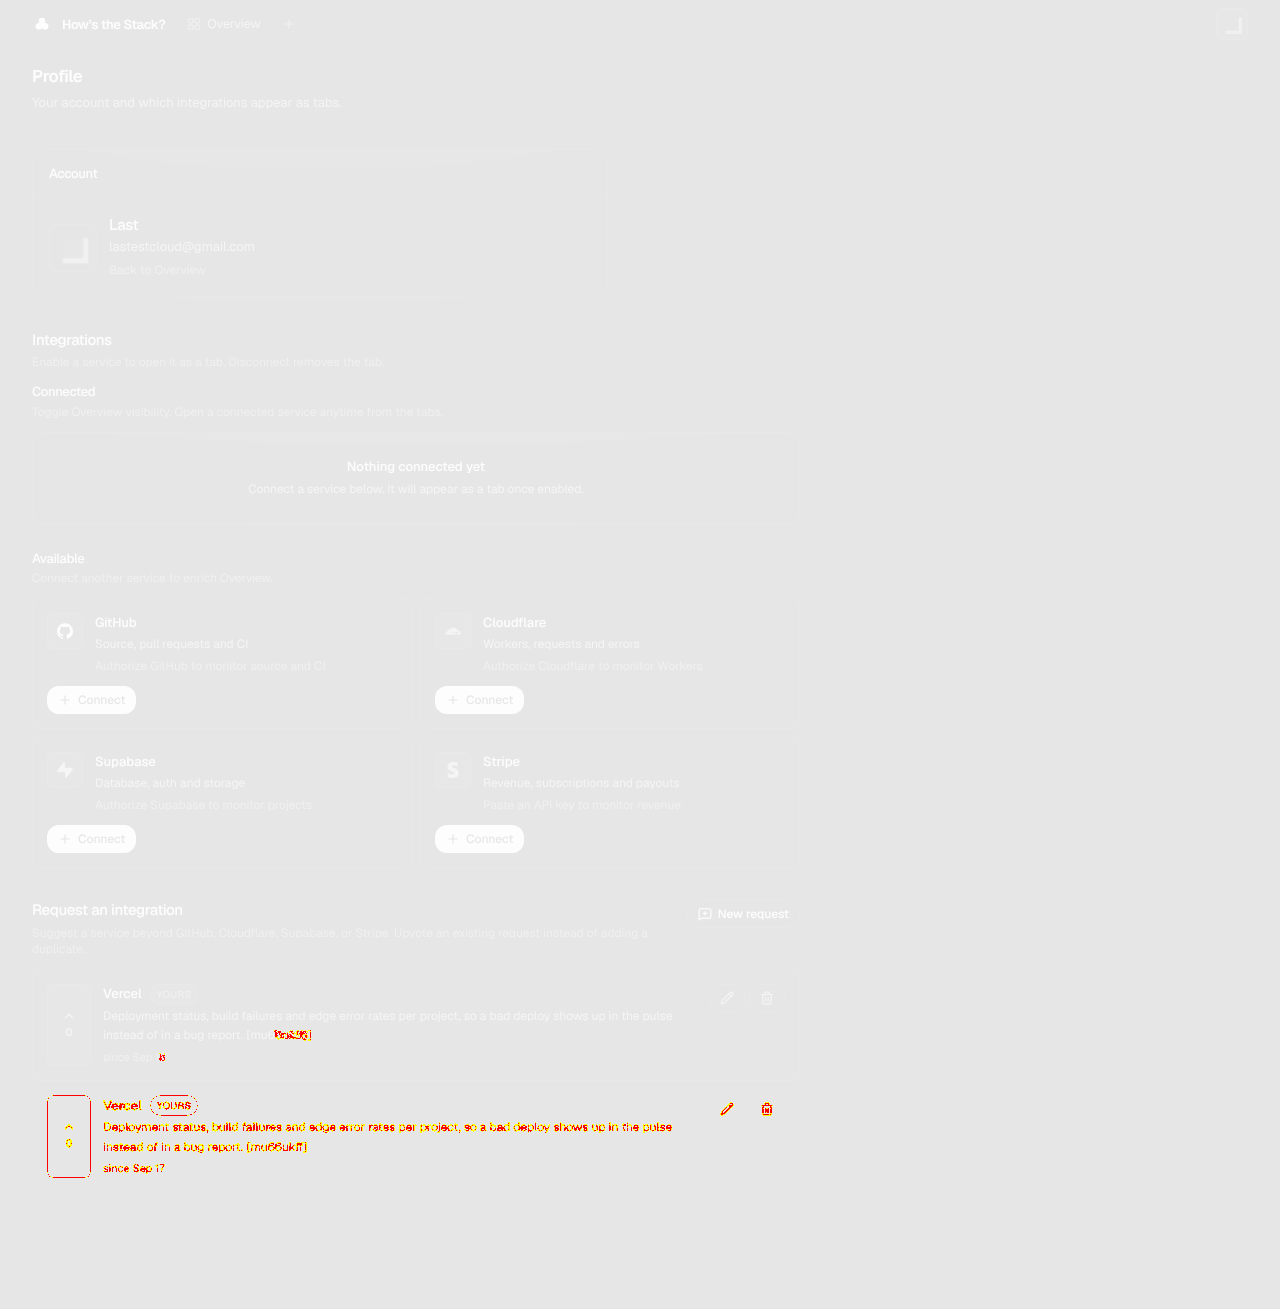
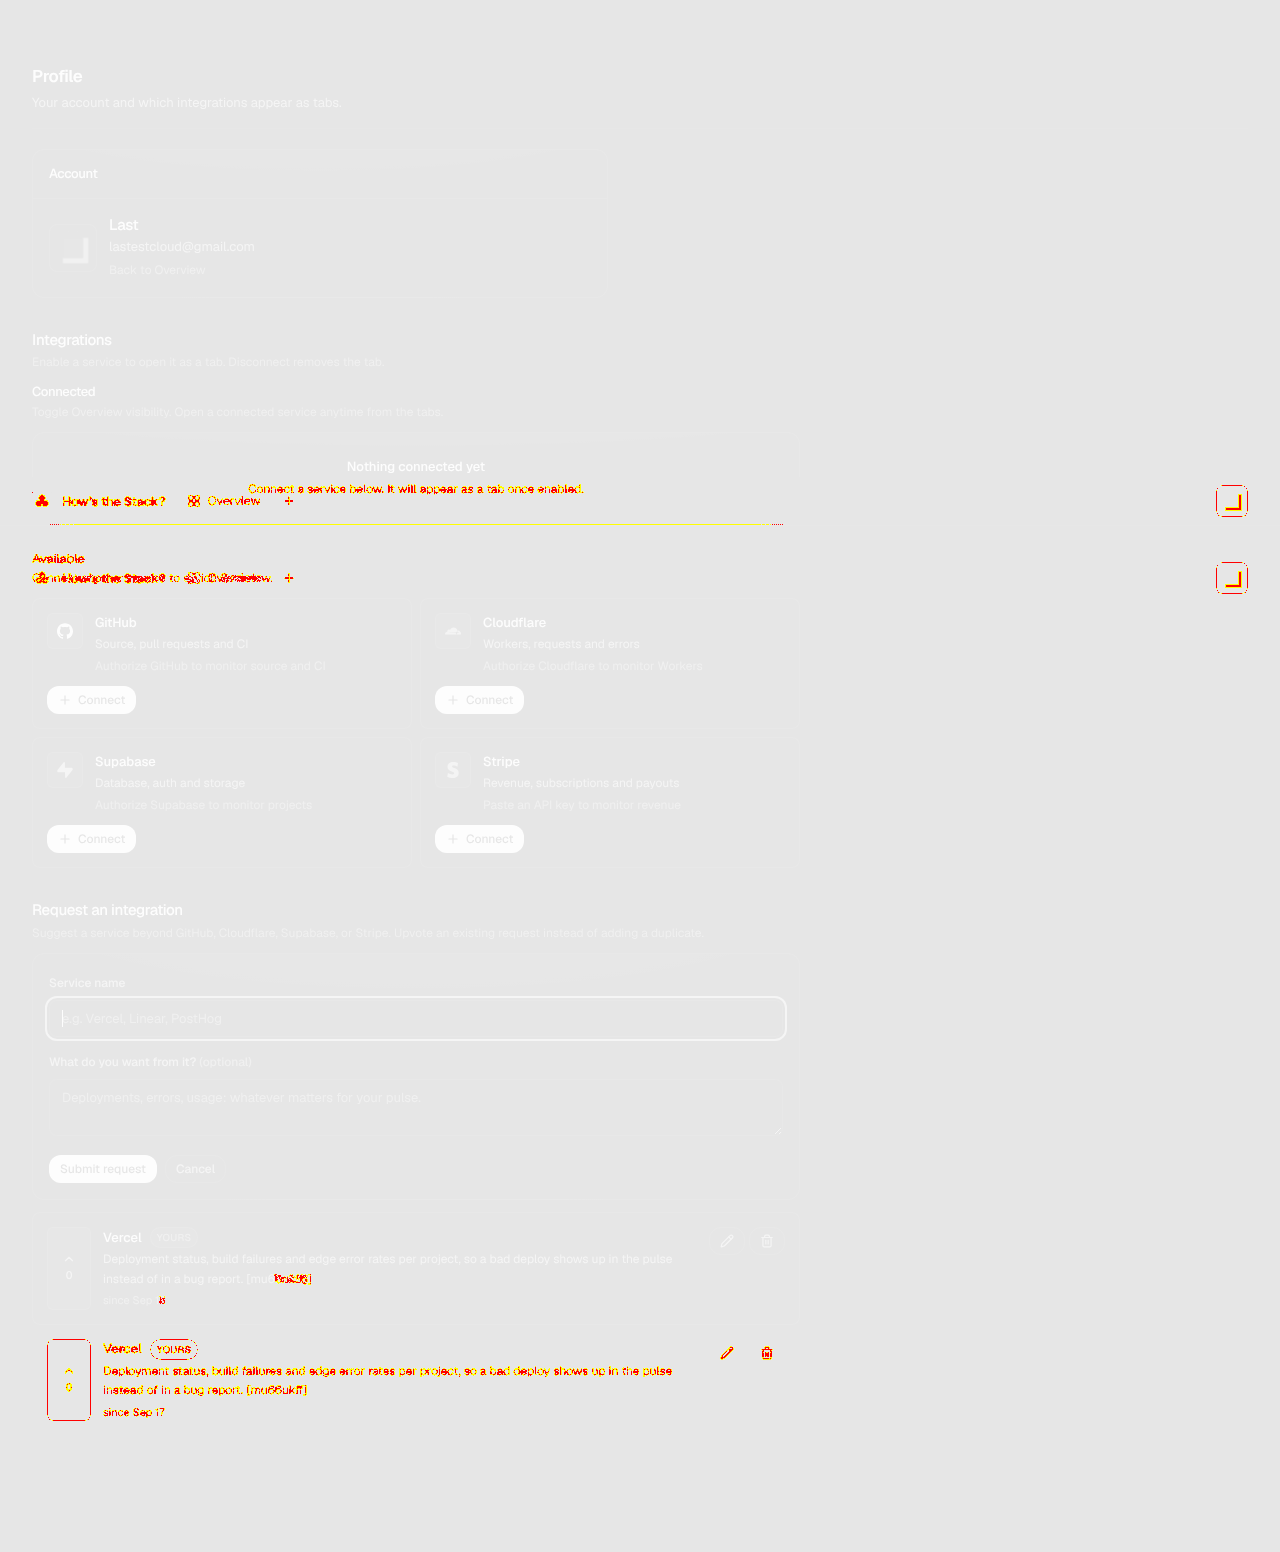
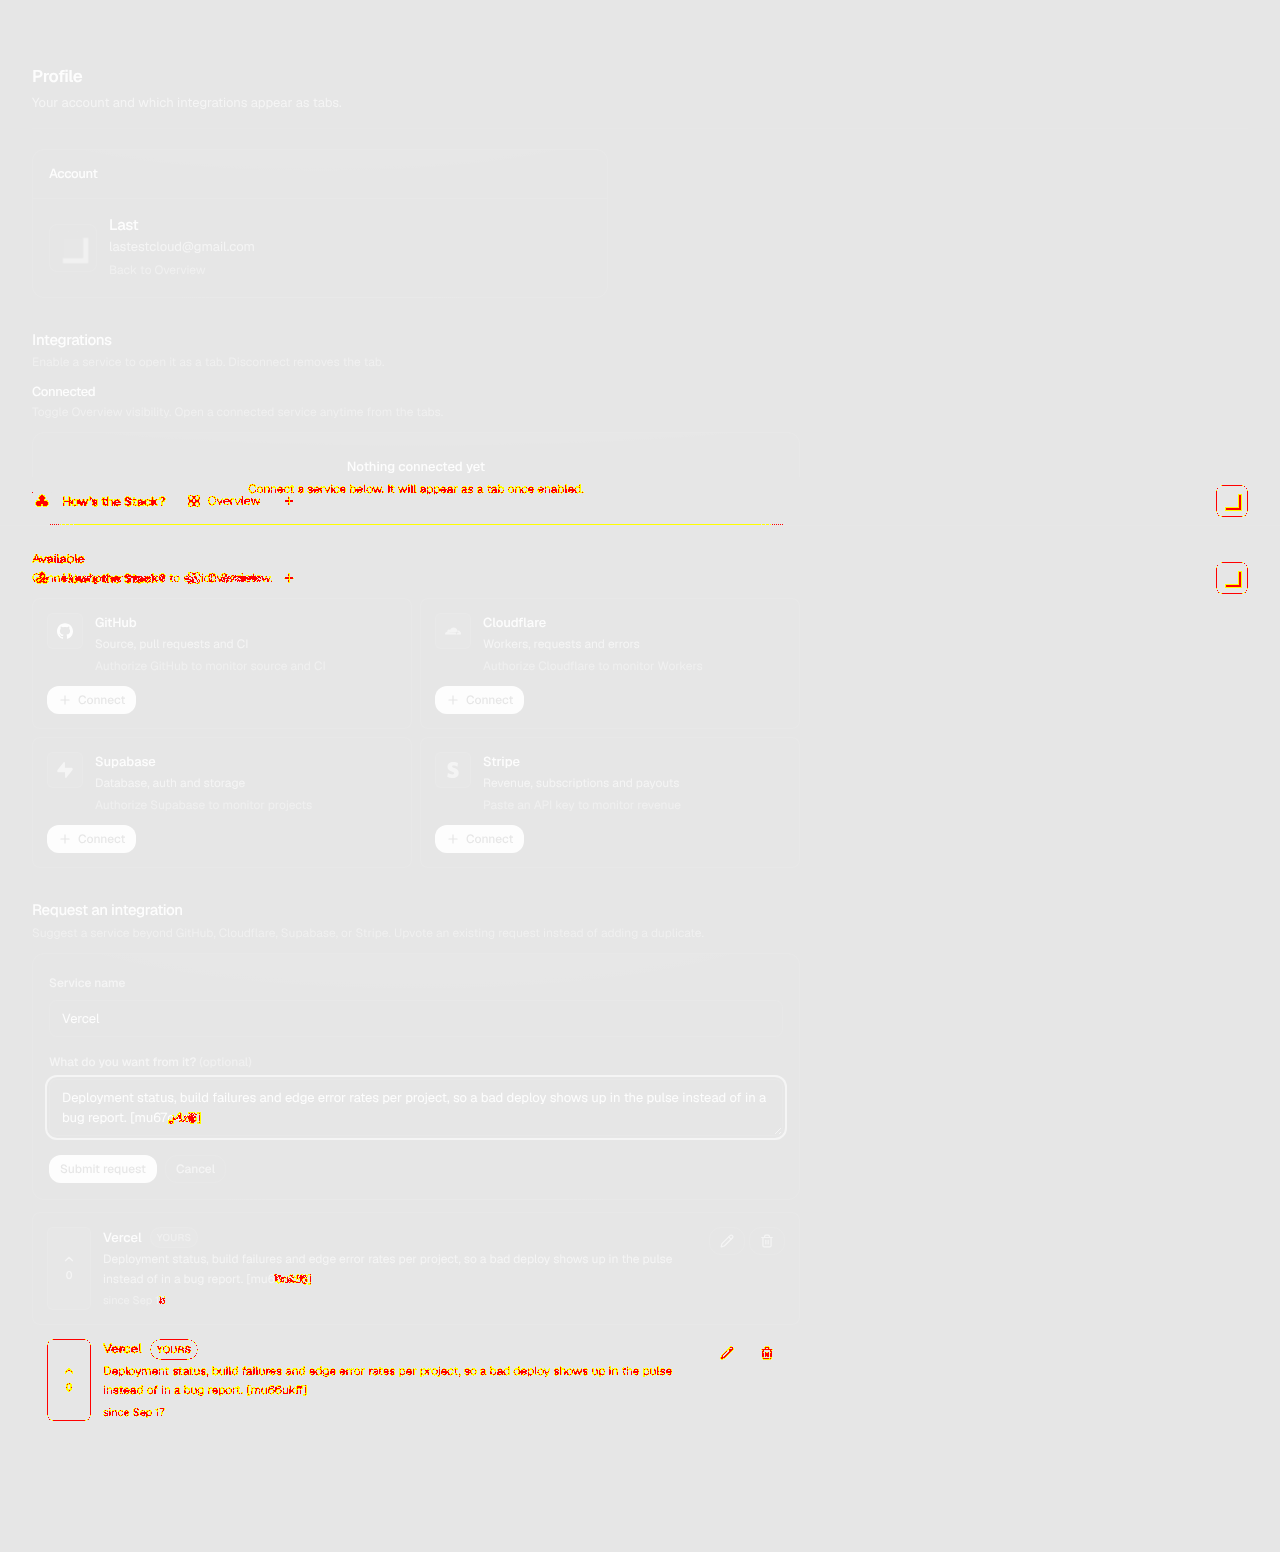
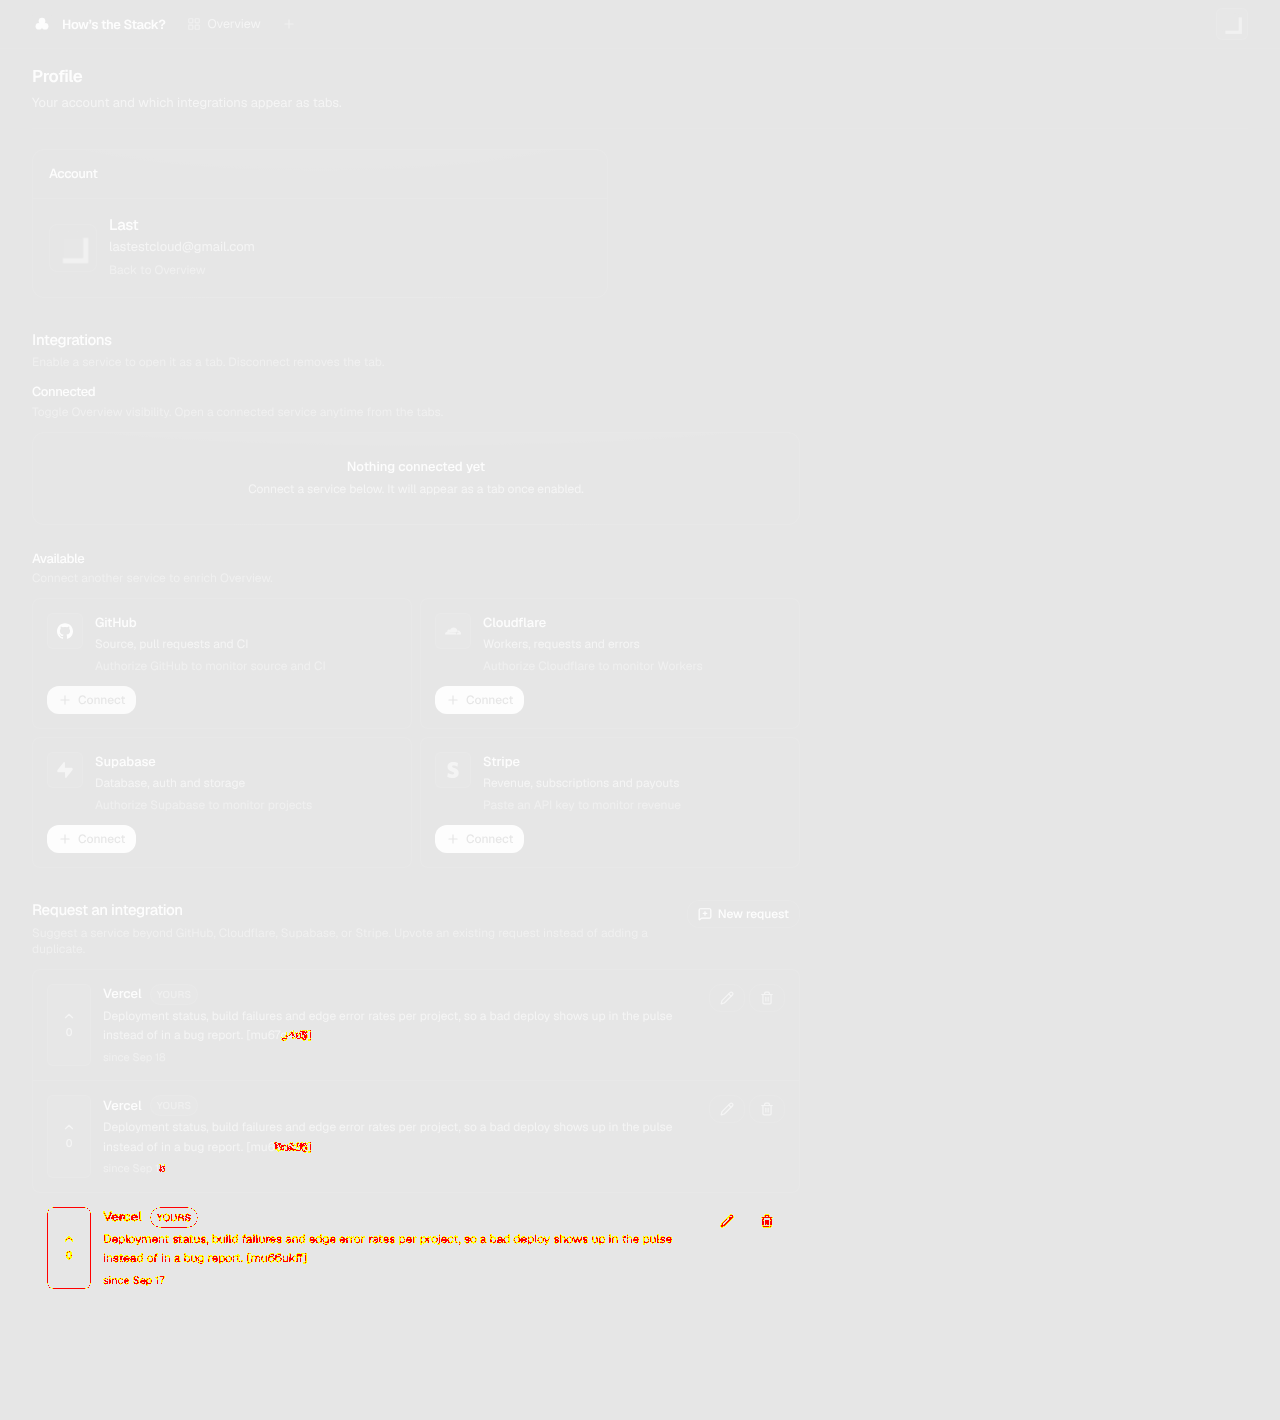
- Integration requests are first-classA built-in request board with upvotes and an explicit 'Upvote an existing request instead of adding a duplicate' nudge. We filed a Vercel request and it appeared immediately, tagged YOURS.
- Read-only framing builds trustThe sign-up page leads with READ-ONLY INTEGRATIONS and 'Encrypted session'. For a tool asking for GitHub, Cloudflare and Stripe access, saying that before the OAuth button is the right order.
- The time-range control does nothing until something is connectedToday, 7 days and 30 days all render an identical empty Overview. A new user's first instinct is to press them, and nothing moves. Disabling the range switcher until the first integration lands, or showing a sample pulse behind a 'demo data' label, would make the first minute feel alive.
- Zero state asks for four OAuth grants before any payoffThe only route out of 'Nothing connected yet' is authorizing GitHub, Cloudflare, Supabase or pasting a Stripe key. That is a large ask before a visitor has seen the product do anything. A read-only public demo workspace would let people judge it first.
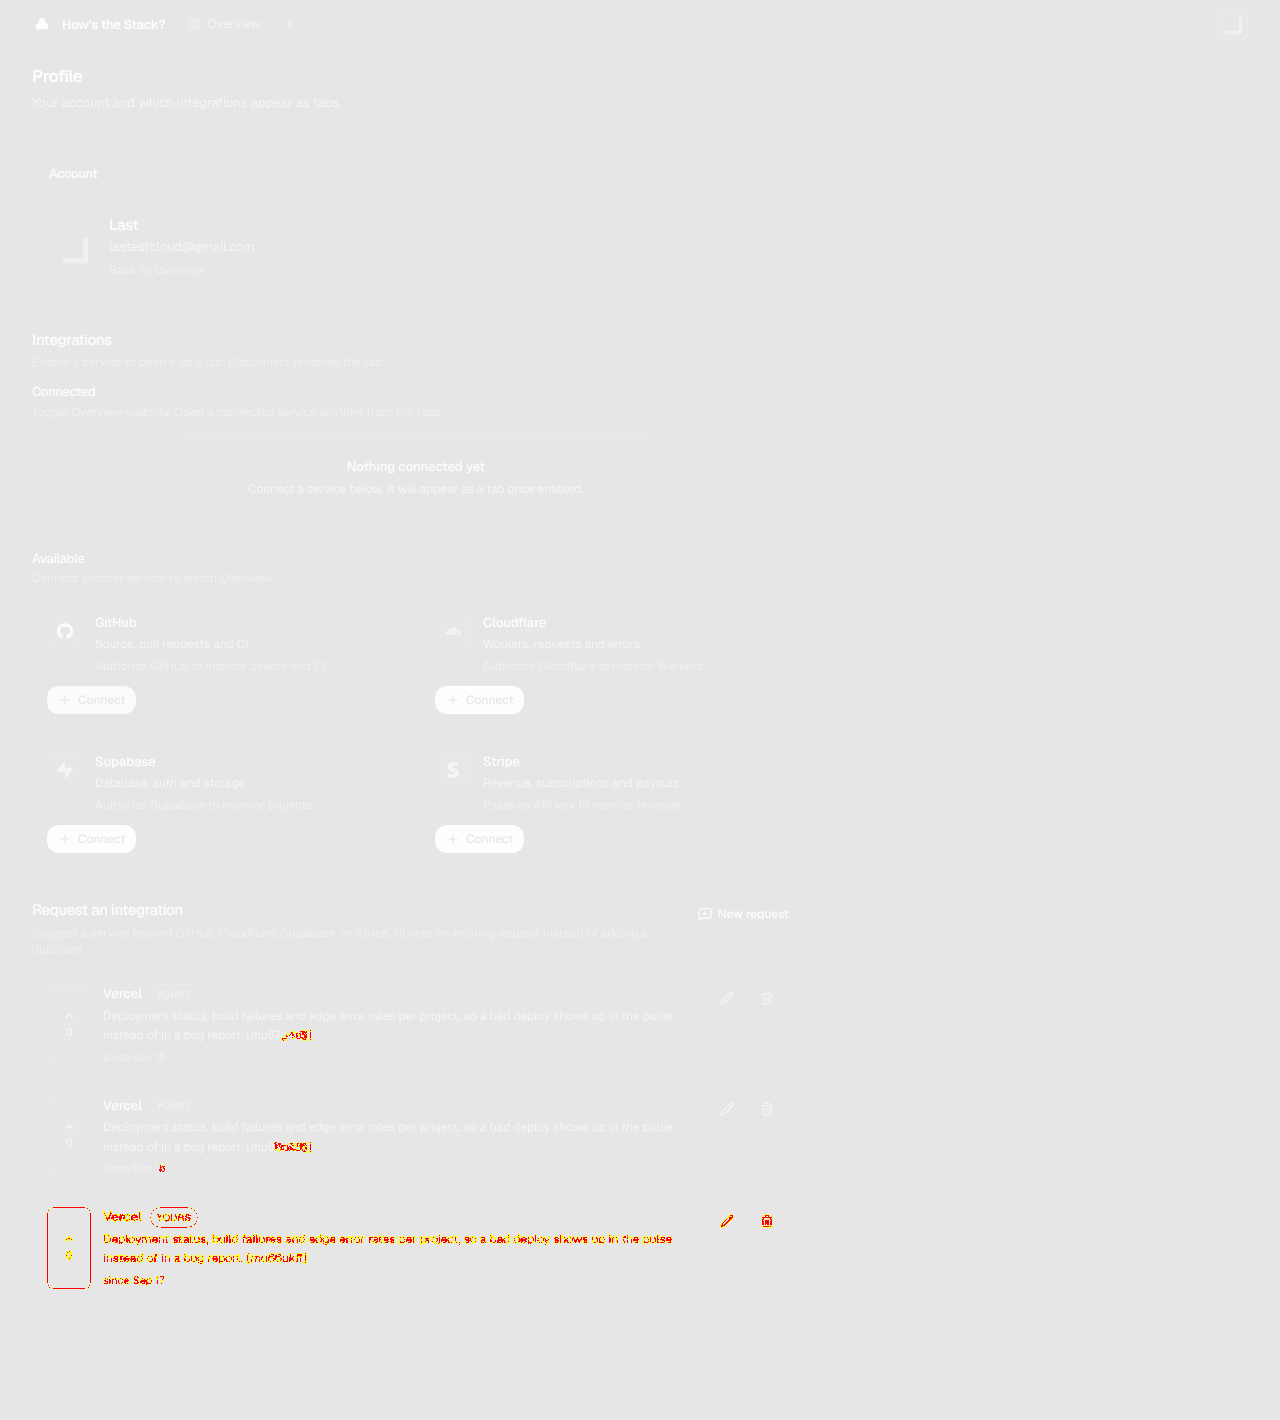
6 visual changes












Share this run
Proof your app is not AI slop
This test was built for howsthestack.com — claim it free
One click copies the test and baseline screenshots into your own Lastest workspace. Re-run on every deploy and catch regressions before your users do — free, no card required.