

In this video· click a step to jump to it
Test recording
PulseCare — app walkthrough
79,822 ms · 60,491 pixels changed
We built this regression test for pulsecare.cloud — it's yours to keep, free.
Take this test with you
This is a real Playwright test, recorded against pulsecare.cloud. Claim it into your own workspace and re-run it on every deploy — free.
export async function test(page, baseUrl, screenshotPath, stepLogger) {
  const shot = (n, slug) => screenshotPath.replace('.png', `-${n}-${slug}.png`);
  const SCROLL_THROUGH = "(async () => { const ease = t => 1 - Math.pow(1 - t, 3); const max = Math.max(0, document.body.scrollHeight - window.innerHeight); if (max < 40) return; const anim = (a, b, ms) => new Promise(res => { const t0 = performance.now(); const step = now => { const p = Math.min(1, (now - t0) / ms); window.scrollTo(0, a + (b - a) * ease(p)); p < 1 ? requestAnimationFrame(step) : res(); }; requestAnimationFrame(step); }); await anim(0, max, 1400); await new Promise(r => setTimeout(r, 350)); await anim(max, 0, 800); })()";

  await page.context().setExtraHTTPHeaders({ 'User-Agent': 'Mozilla/5.0 (X11; Linux x86_64) AppleWebKit/537.36 (KHTML, like Gecko) Chrome/132.0.0.0 Safari/537.36' });
  await page.route('**/cdn-cgi/scripts/**', function (r) { r.abort(); }).catch(function () {});
  await page.route('**/*sentry-cdn.com/**', function (r) { r.abort(); }).catch(function () {});

  const findings = [];

  // ── Scenario 1: public home (context) ─────────────────────────────────────
stepLogger.log('Scenario 1: Home');Checks run
Notes from the demo run
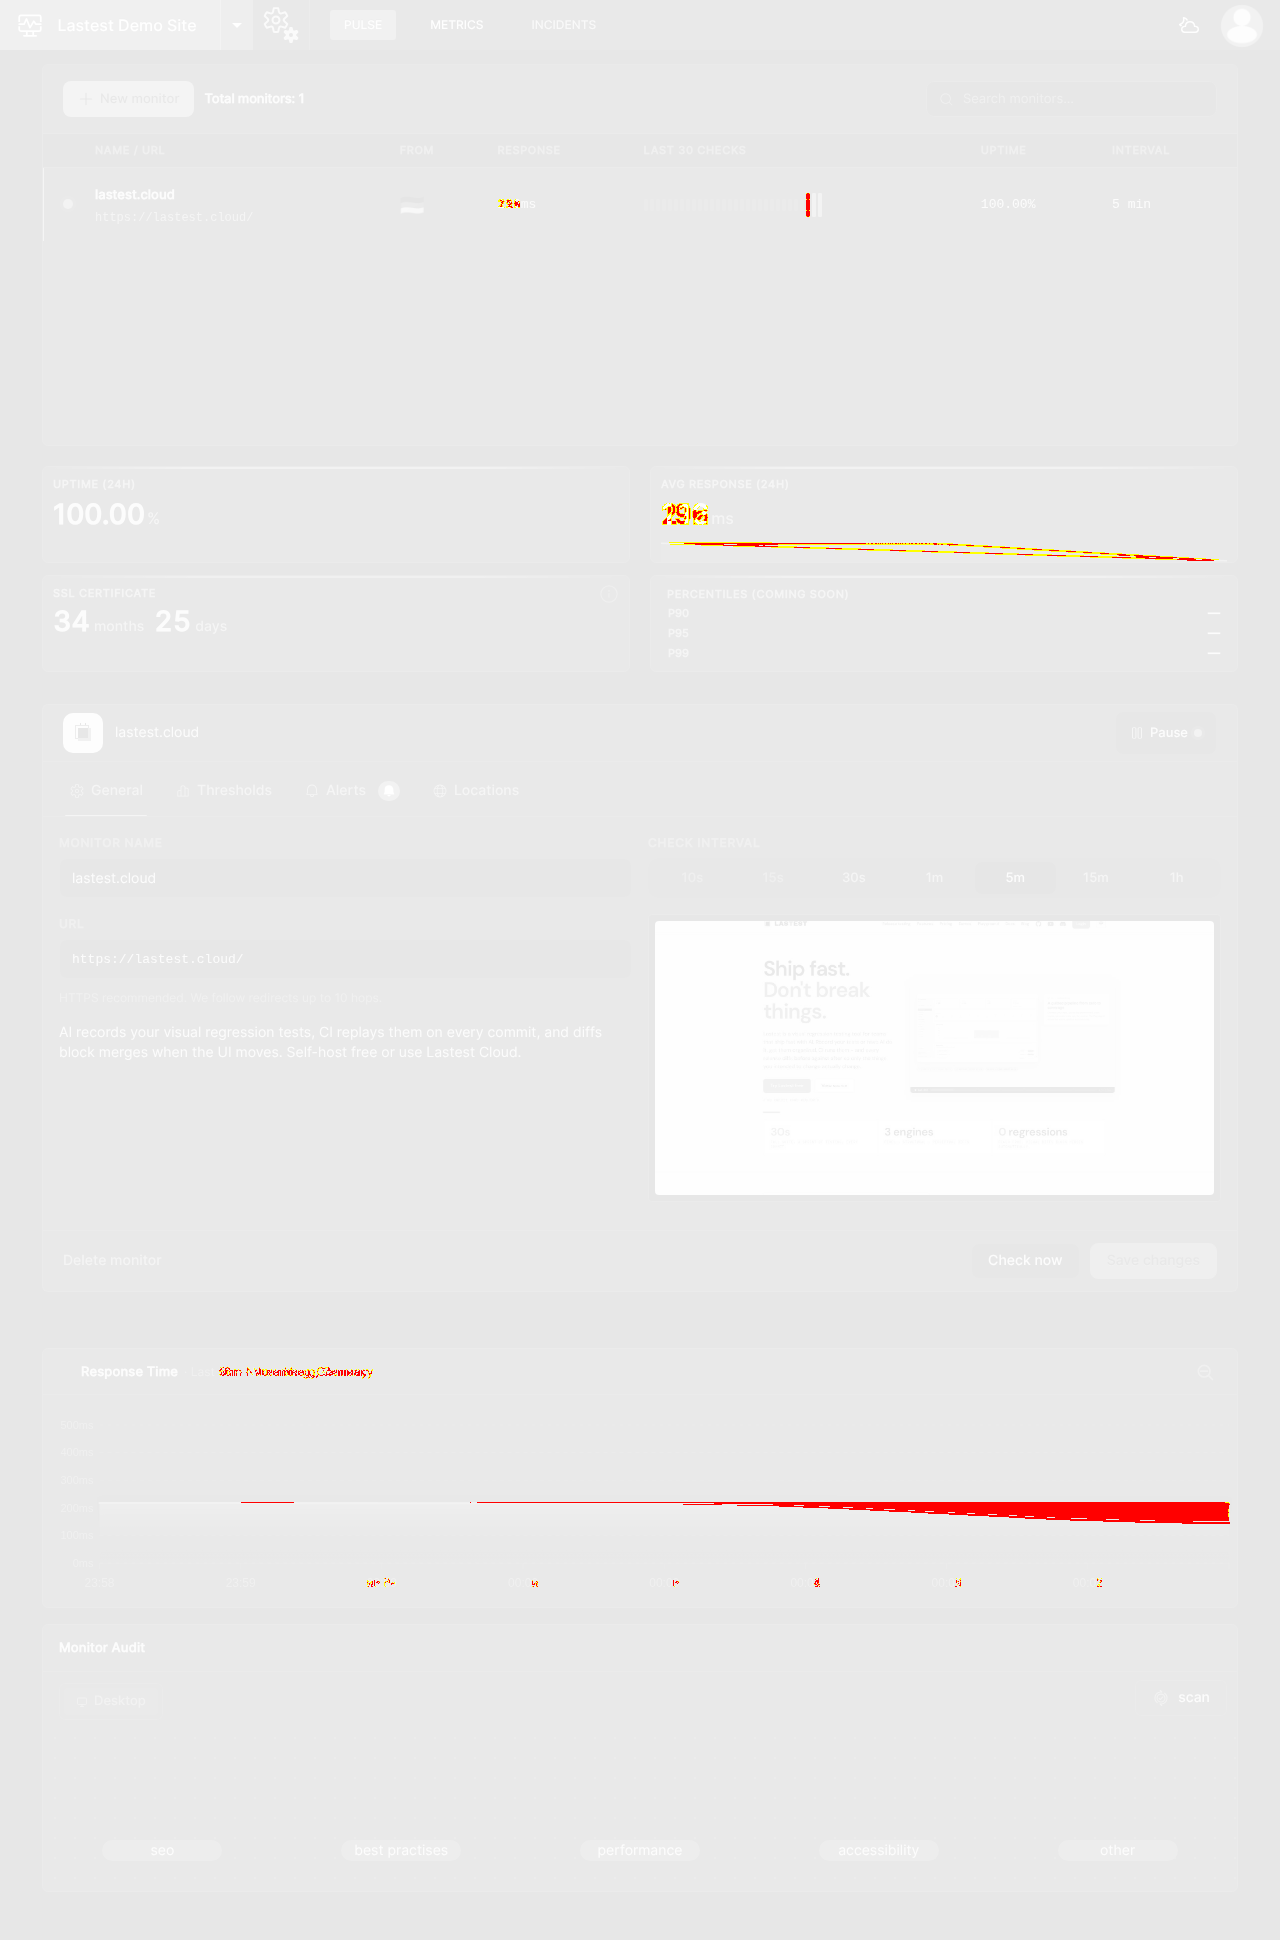
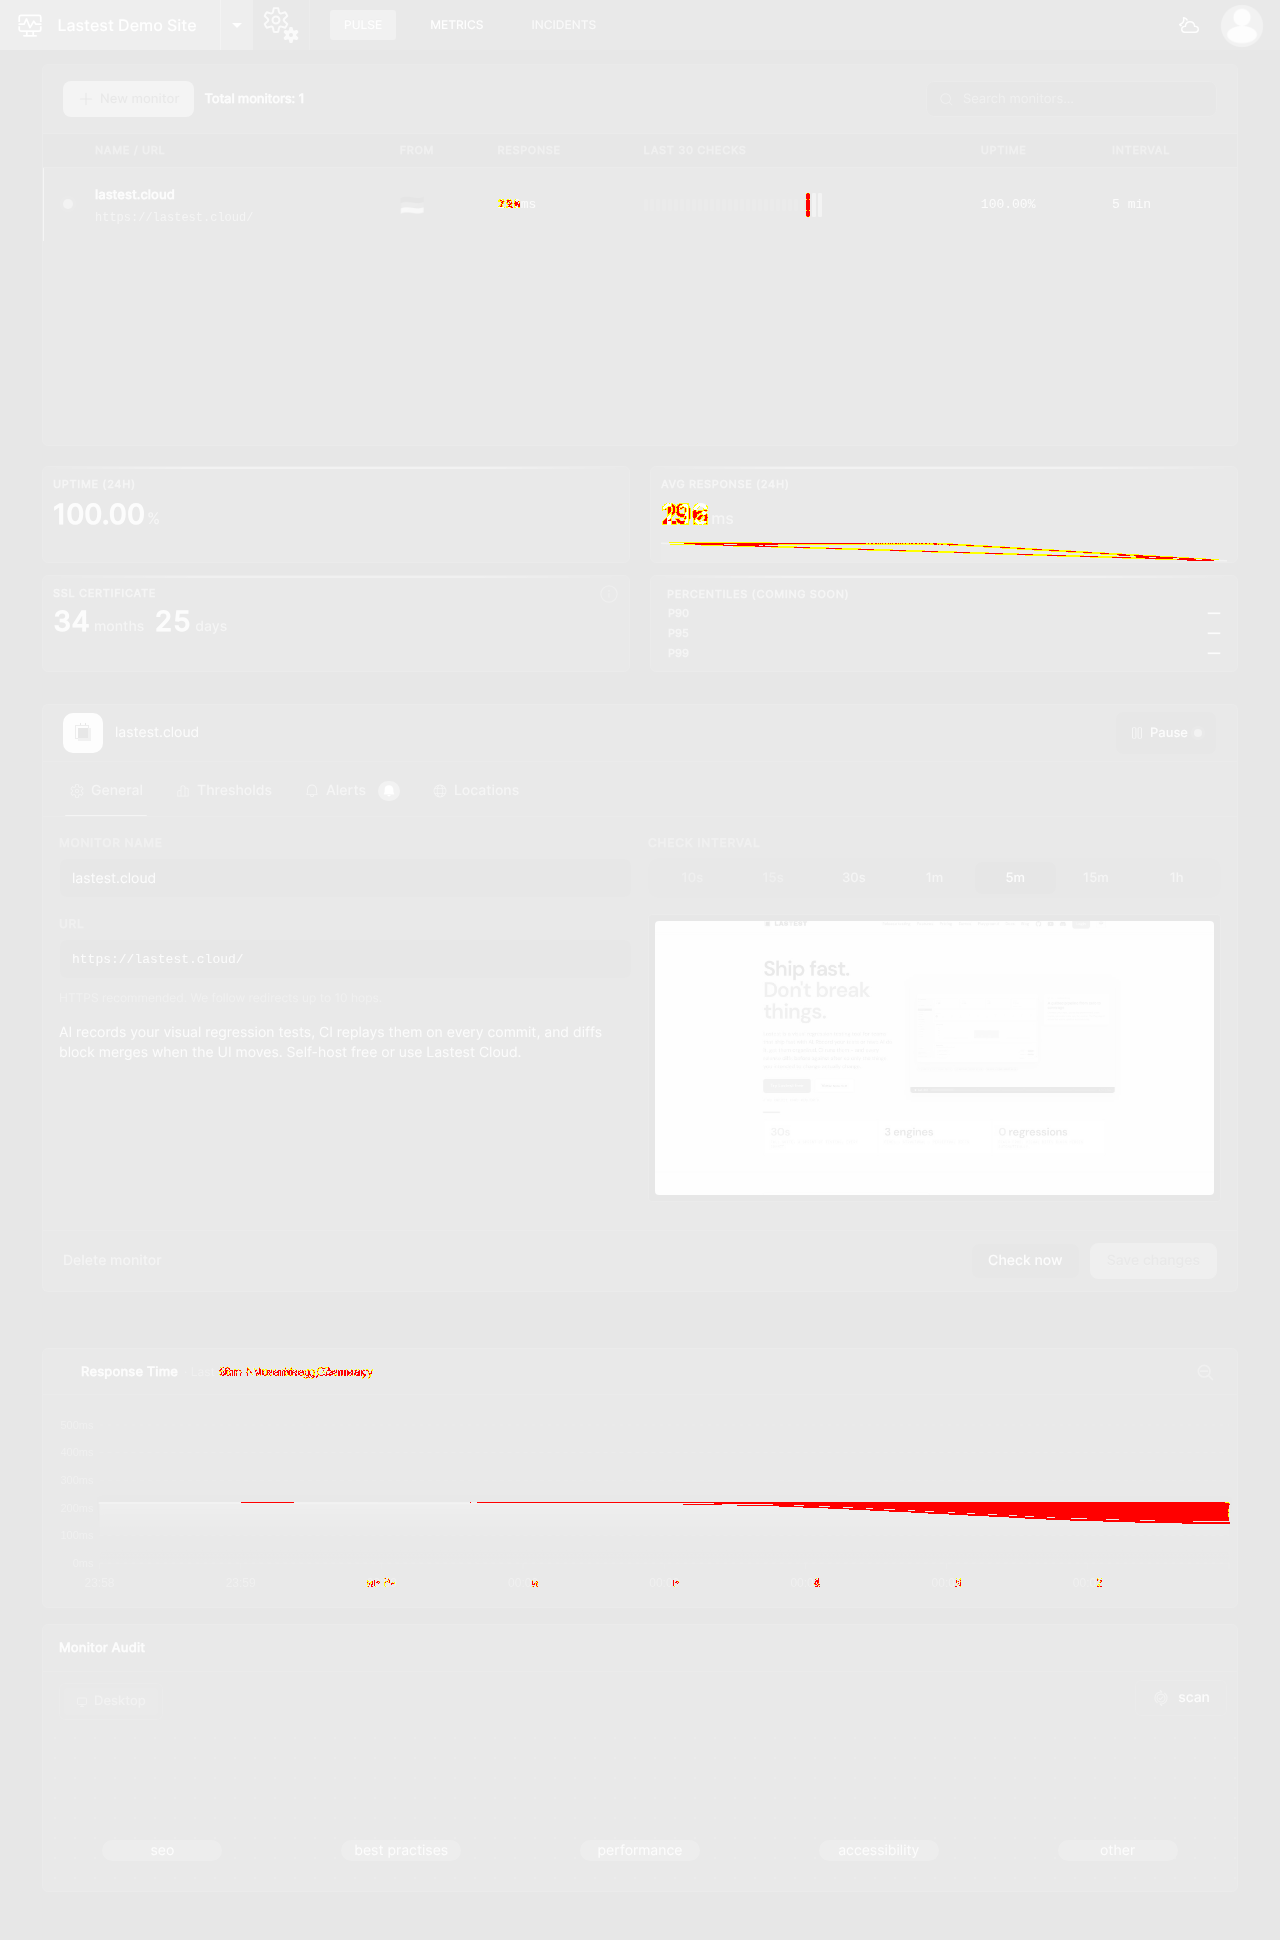
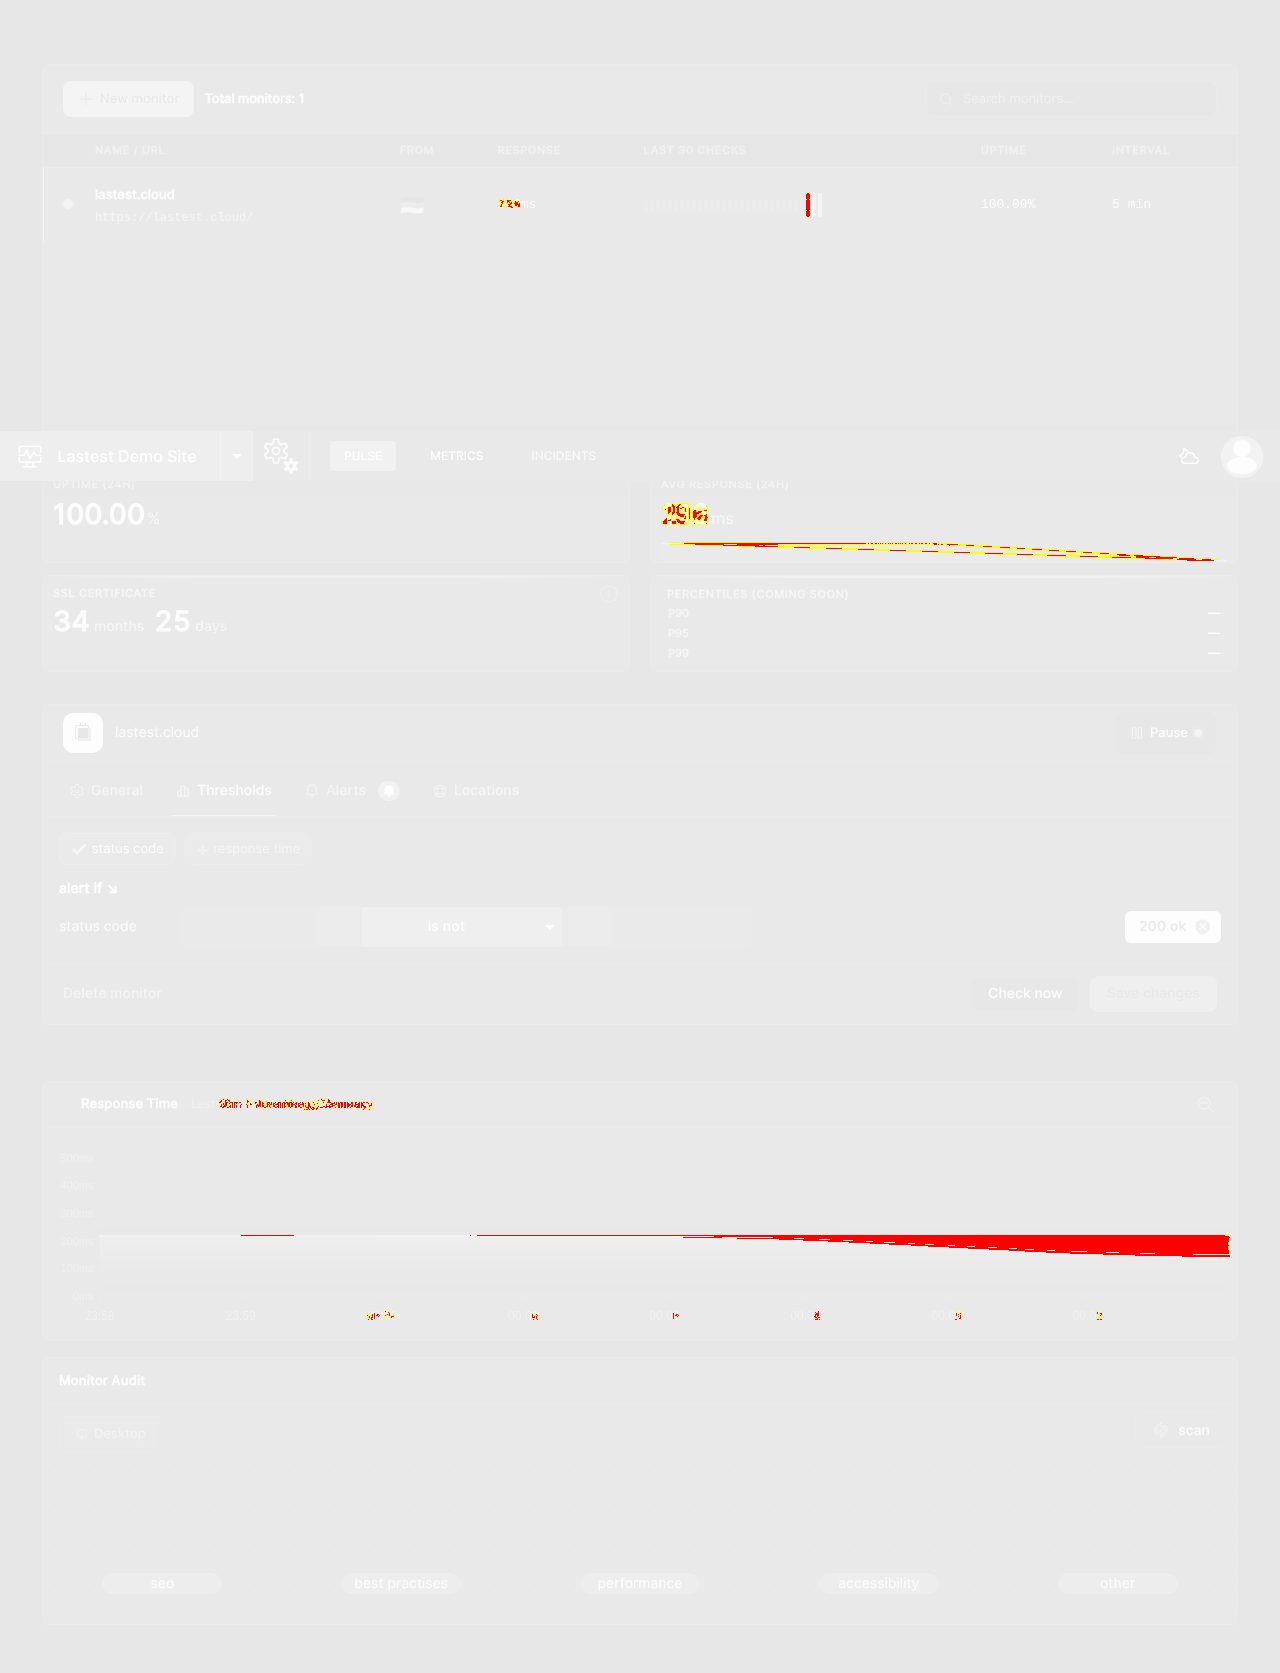
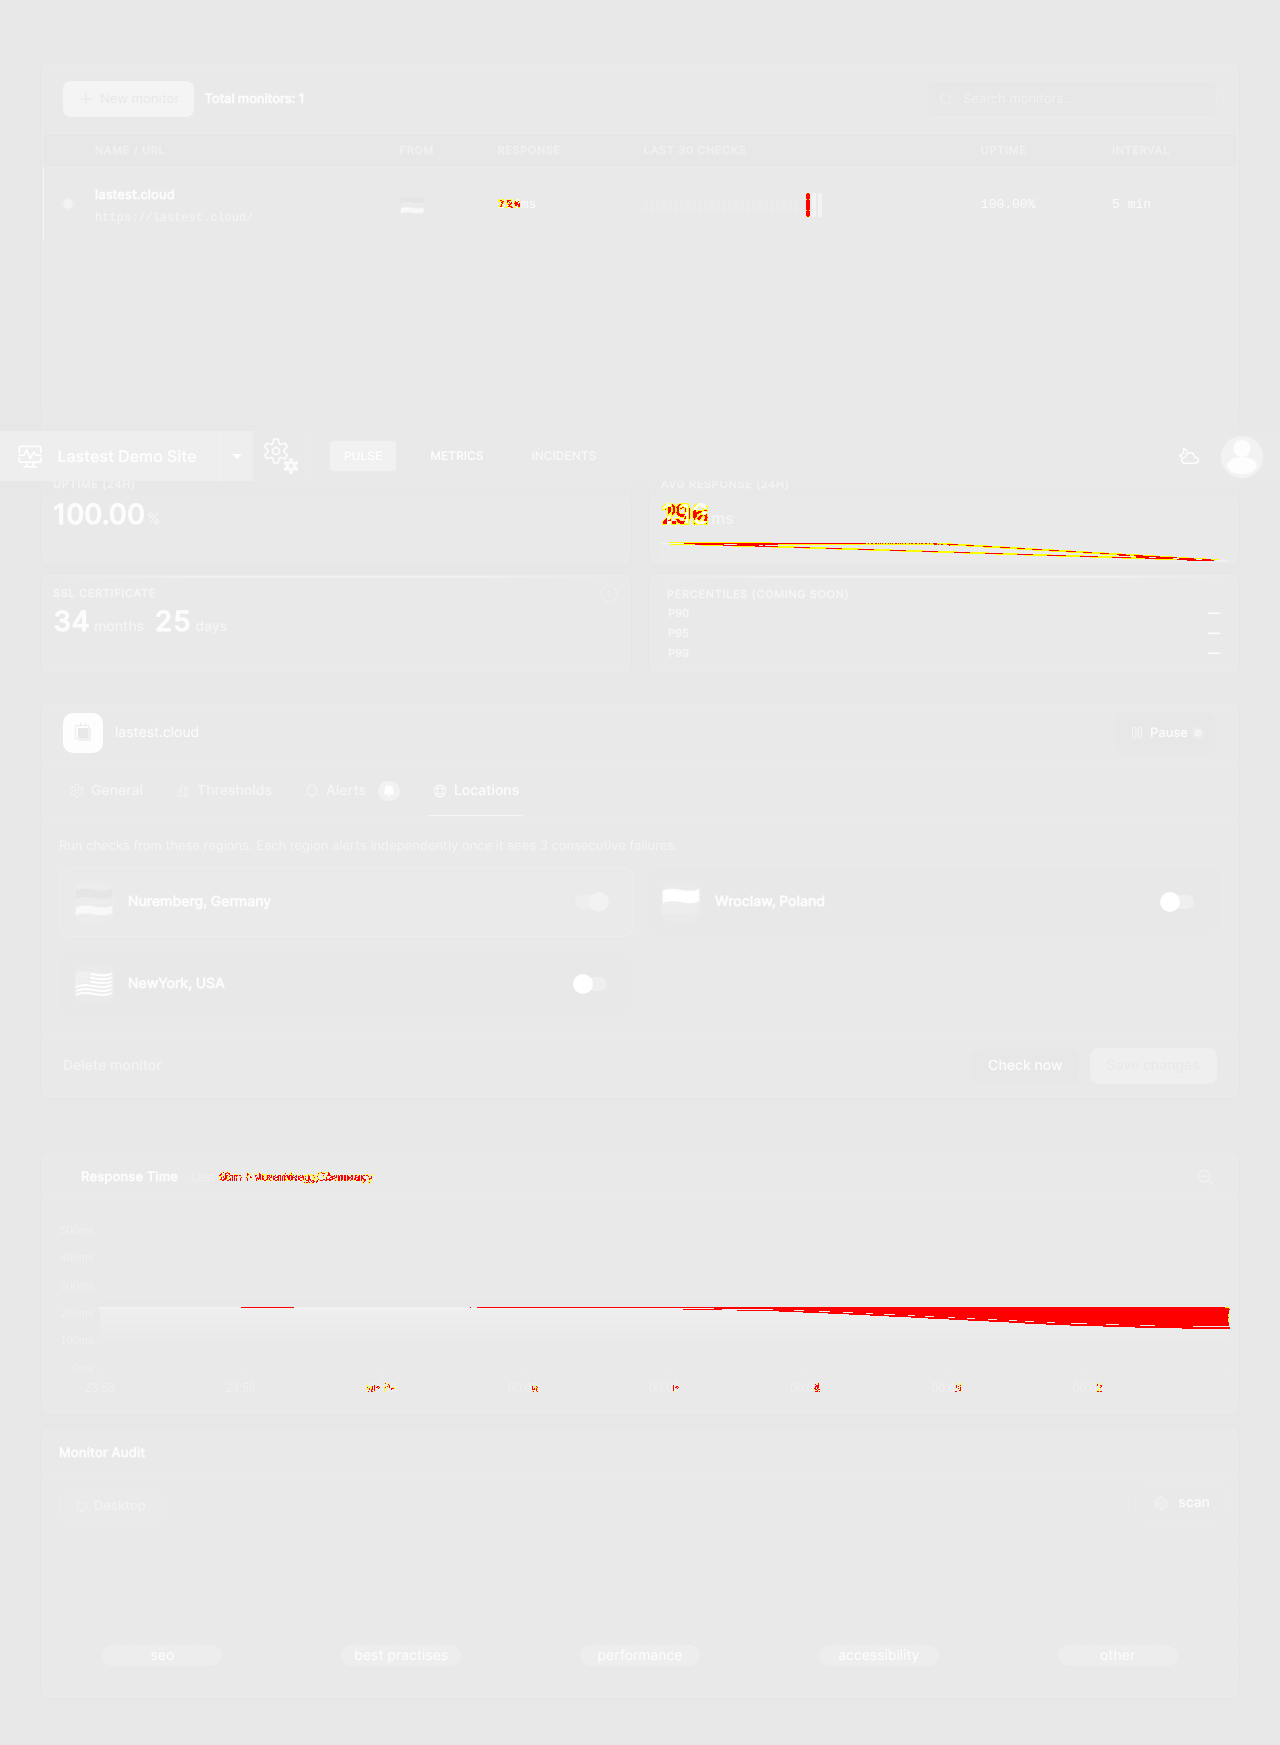
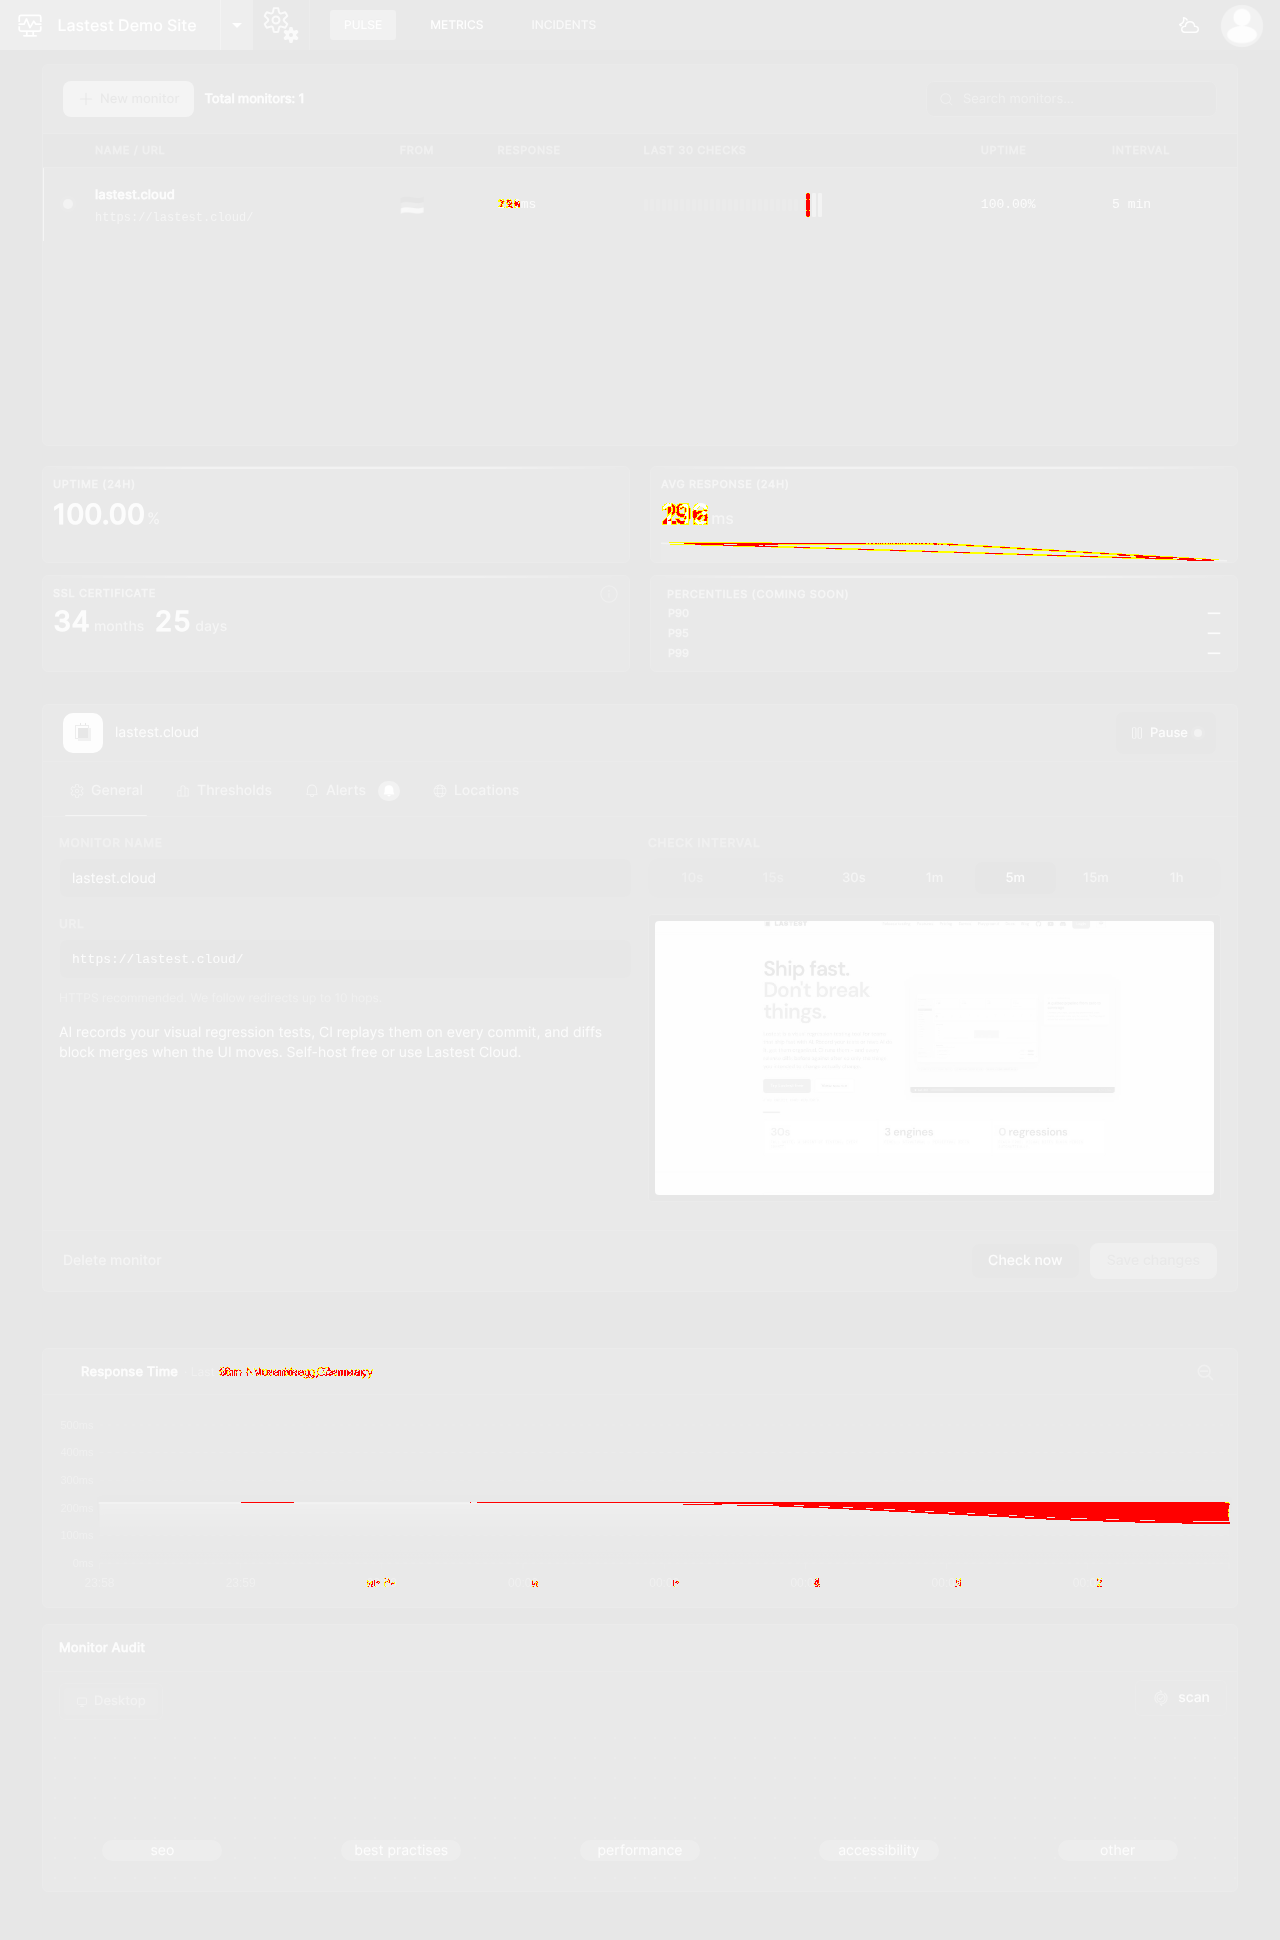
AI-generatedWe registered on PulseCare, activated via your confirmation email, logged in, created a project and a monitor for lastest.cloud, then walked the authenticated app: pulse dashboard, monitor detail, the General/Thresholds/Alerts/Locations tabs, web vitals, Lighthouse audits, project settings and the new-monitor form. The create-project to first-check path is genuinely 60 seconds as advertised, and within one check cycle the dashboard was showing real uptime, a real response-time series and a full SSL certificate chain.
- First check lands before you finish looking aroundCreating the monitor auto-advanced to the dashboard and within one cycle we had 100.00% uptime, 218ms response, and a live response-time chart. Time-to-value is the thing monitoring tools usually get wrong, and you got it right.
- SSL panel shows the real chain, not just a countdownSubject CN, issuer (Google Trust Services WE1), validity window and SANs are all on the monitor detail. Most competitors show 'expires in N days' and stop.
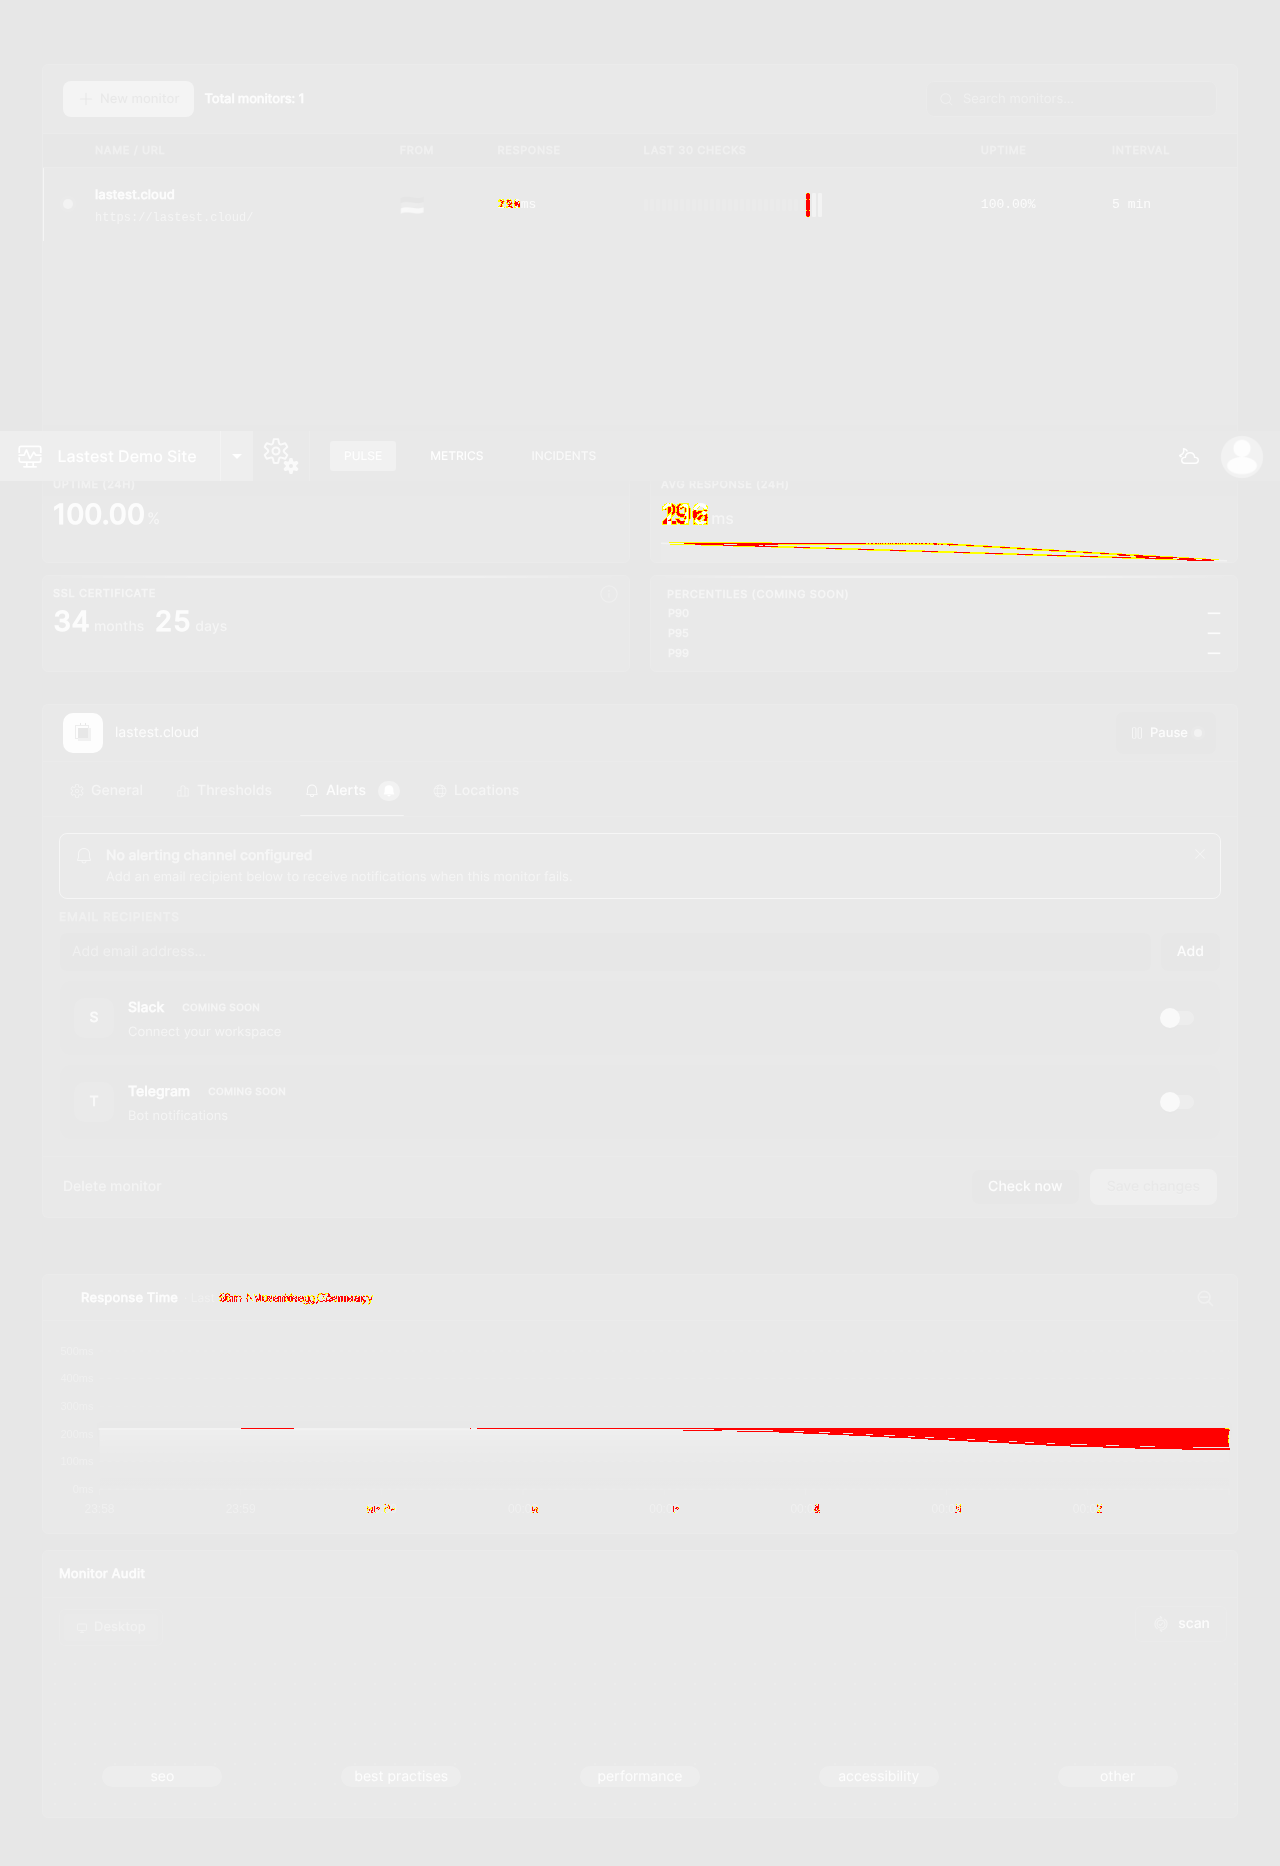
- Alerts tab flags its own empty stateThe Alerts tab carries a red badge and says 'No alerting channel configured' — the product tells you it is not yet useful rather than quietly monitoring into the void.
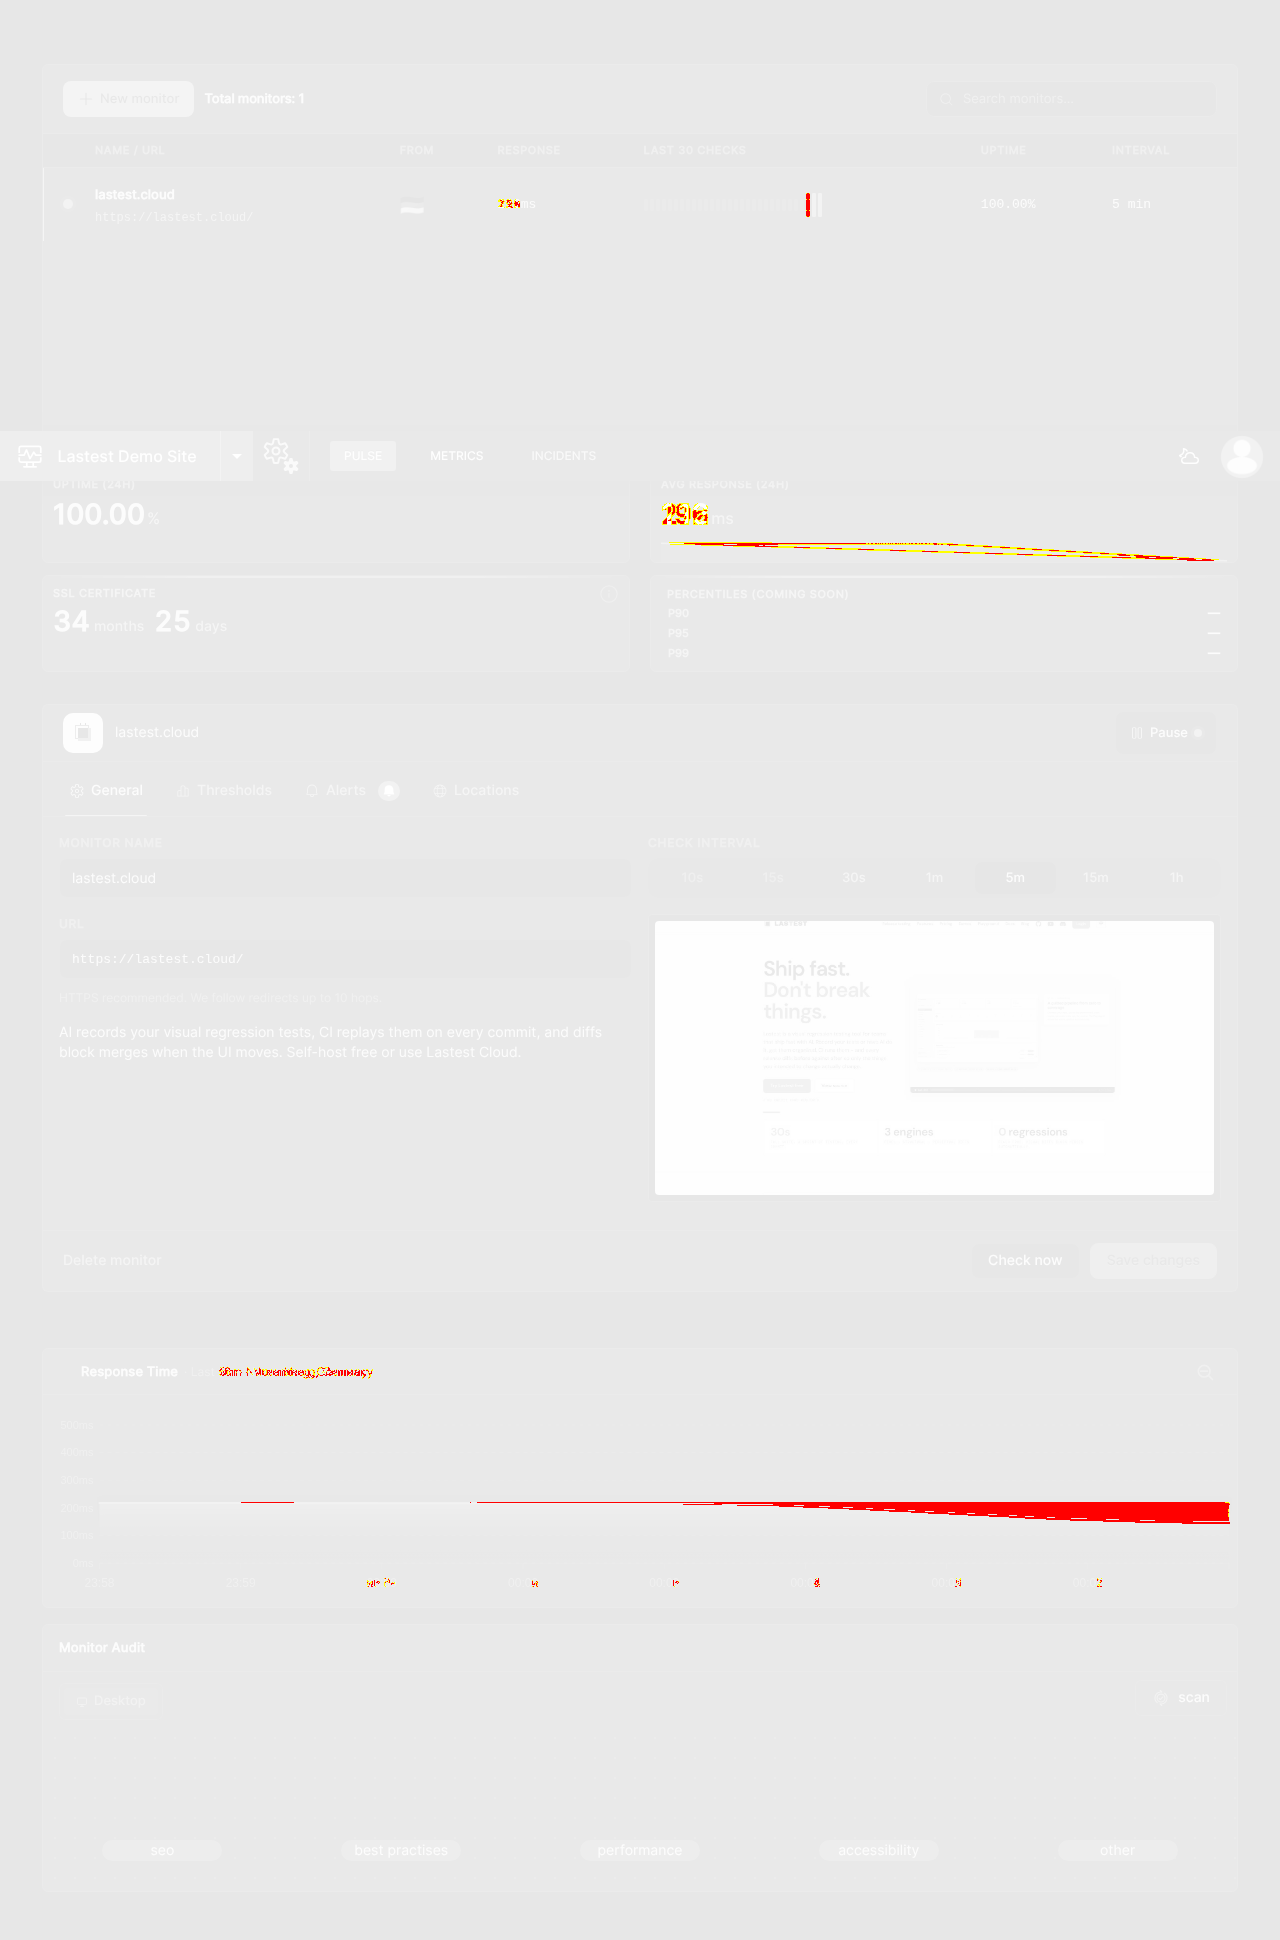
- The INCIDENTS nav item does not navigateClicking INCIDENTS in the top nav leaves you on the pulse dashboard — no route change, no panel, no empty state. PULSE and METRICS both work, so it reads as broken rather than 'not built yet'. A disabled style or a 'no incidents yet' view would fix the impression.
- 'PERCENTILES (COMING SOON)' occupies a primary dashboard cardP90/P95/P99 render as em-dashes in one of the four hero cards on the main dashboard. That is prime space showing a placeholder on a brand-new account's first screen.
8 visual changes

















Share this run
Proof your app is not AI slop
This test was built for pulsecare.cloud — claim it free
One click copies the test and baseline screenshots into your own Lastest workspace. Re-run on every deploy and catch regressions before your users do — free, no card required.