

In this video· click a step to jump to it
Test recording
Profflow — app walkthrough
136,851 ms · 33,095 pixels changed
We built this regression test for www.profflow.co — it's yours to keep, free.
Take this test with you
This is a real Playwright test, recorded against www.profflow.co. Claim it into your own workspace and re-run it on every deploy — free.
export async function test(page, baseUrl, screenshotPath, stepLogger) {
  const shot = (n, slug) => screenshotPath.replace('.png', '-' + n + '-' + slug + '.png');
  await page.goto(baseUrl + '/dashboard', { waitUntil: 'domcontentloaded' });
  await page.getByText('Net profit').first().waitFor({ state: 'visible', timeout: 30000 });
  await page.waitForTimeout(2500);
  await page.screenshot({ path: shot(1, 'profit-dashboard'), fullPage: true });
  await page.getByRole('button', { name: /^Analytics$/i }).first().click();
  await page.locator('button[role="tab"][title="Daily P&L"]').first().click();
  await page.waitForTimeout(3500);
  await page.screenshot({ path: shot(2, 'daily-pl'), fullPage: true });
  await page.getByRole('button', { name: /^Analytics$/i }).first().click();
await page.locator('button[role="tab"][title="Marketing"]').first().click();Checks run
Notes from the demo run
AI-generatedWe ran Profflow as a new operator: through the six-step setup, across the profit dashboard, Daily P&L, Ads & Marketing, Break-Even and Forecast, into Invoices, and finished by asking your AI which cost line was eating the most margin. It answered with a real breakdown off the demo figures. Arriving at a populated dashboard before connecting a store is the strongest onboarding decision in the product, and the honesty of the notes under each figure (payment fees are an estimate) buys more trust than a rounder number would.
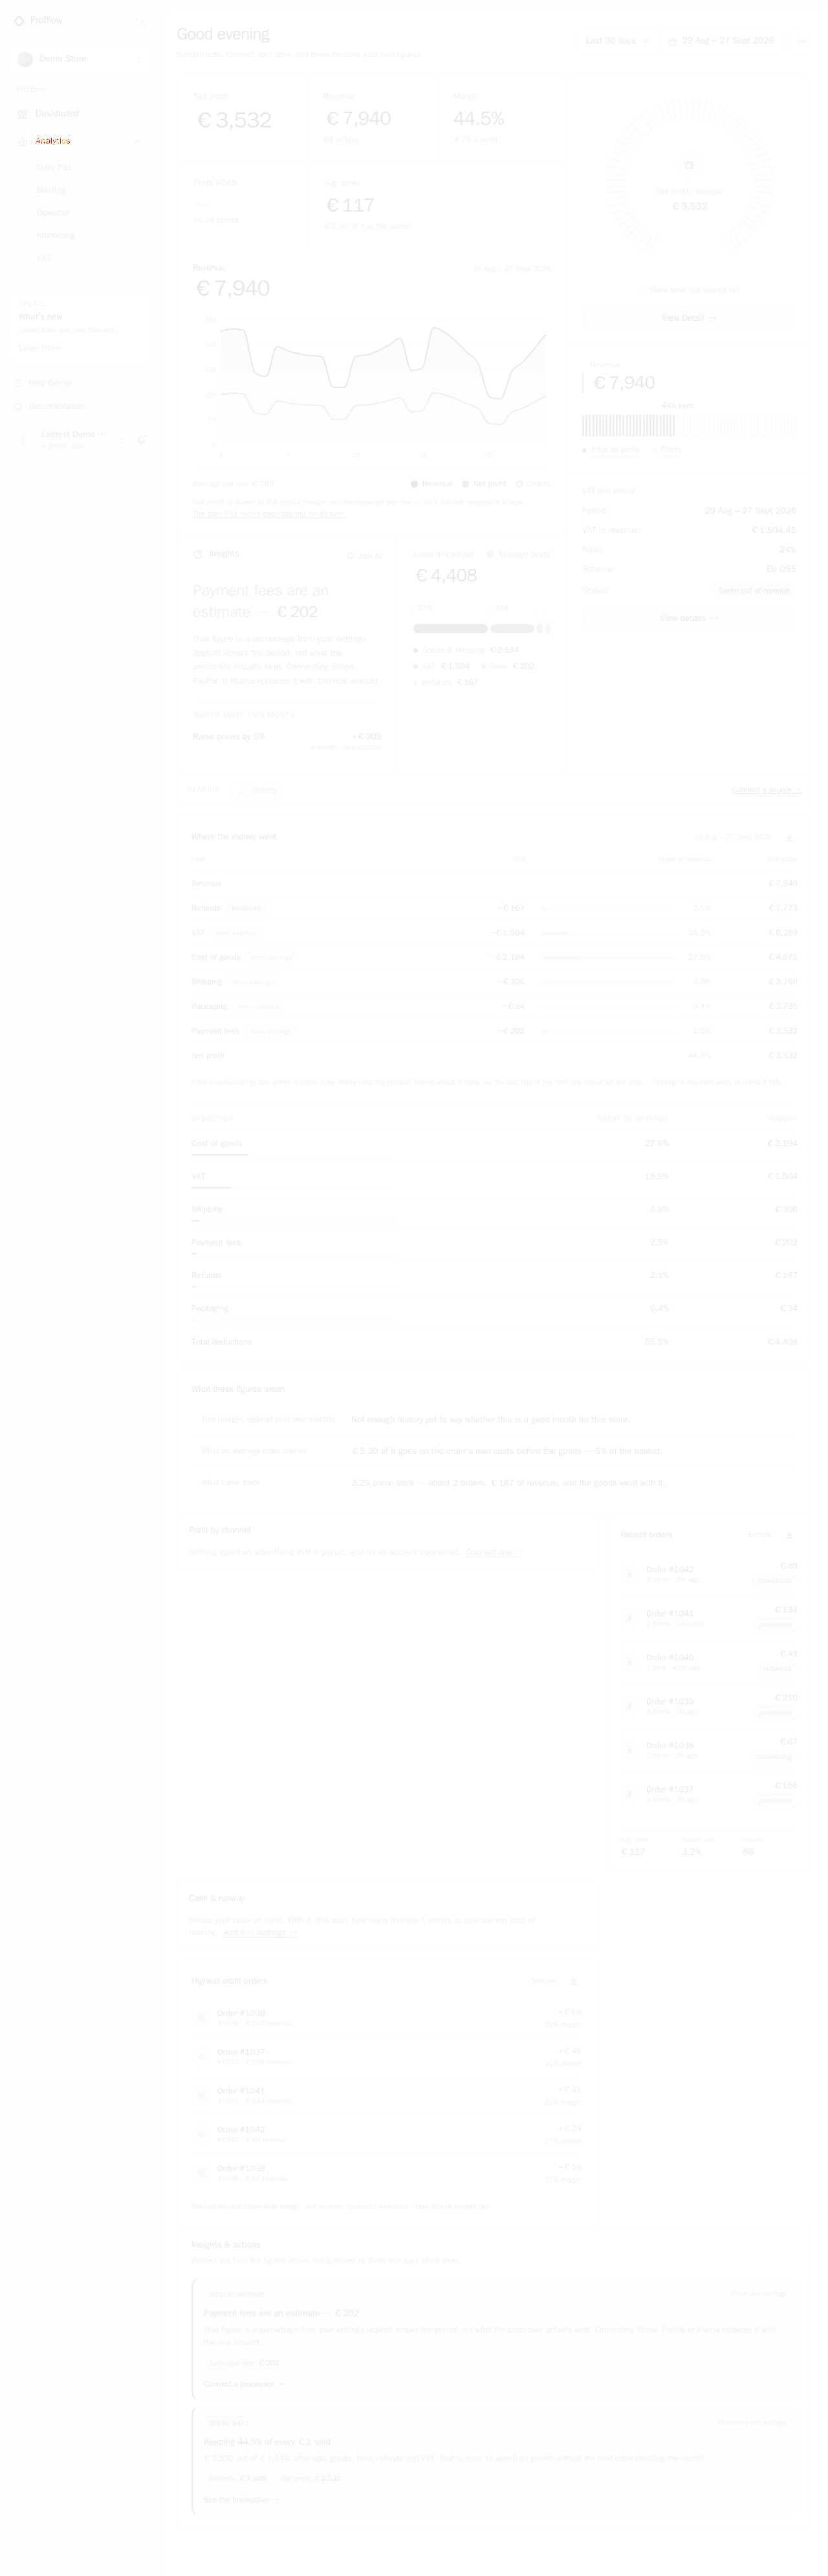
- A populated dashboard before you connect anythingNet profit, revenue, margin and the daily chart all render off Demo Store data. You can judge the product before you hand over a Shopify key.
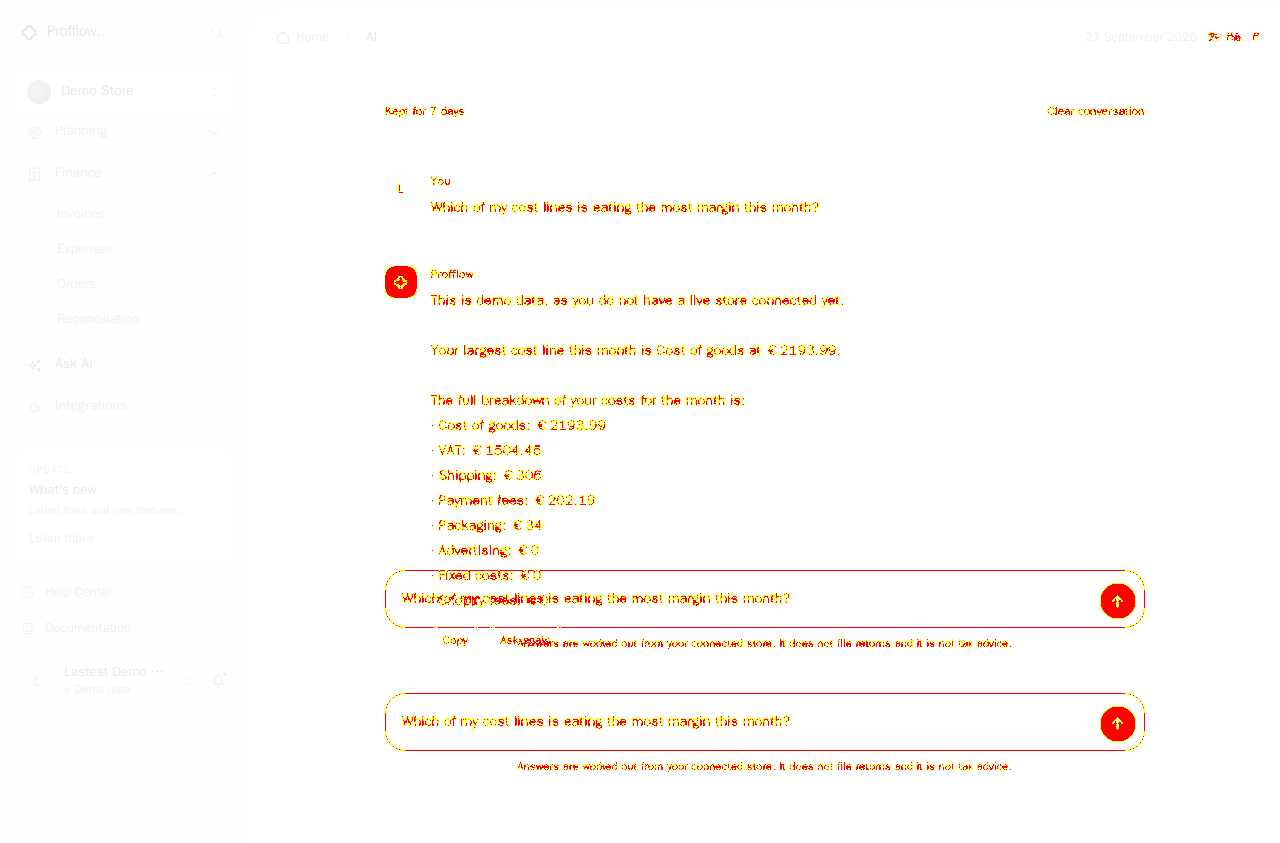
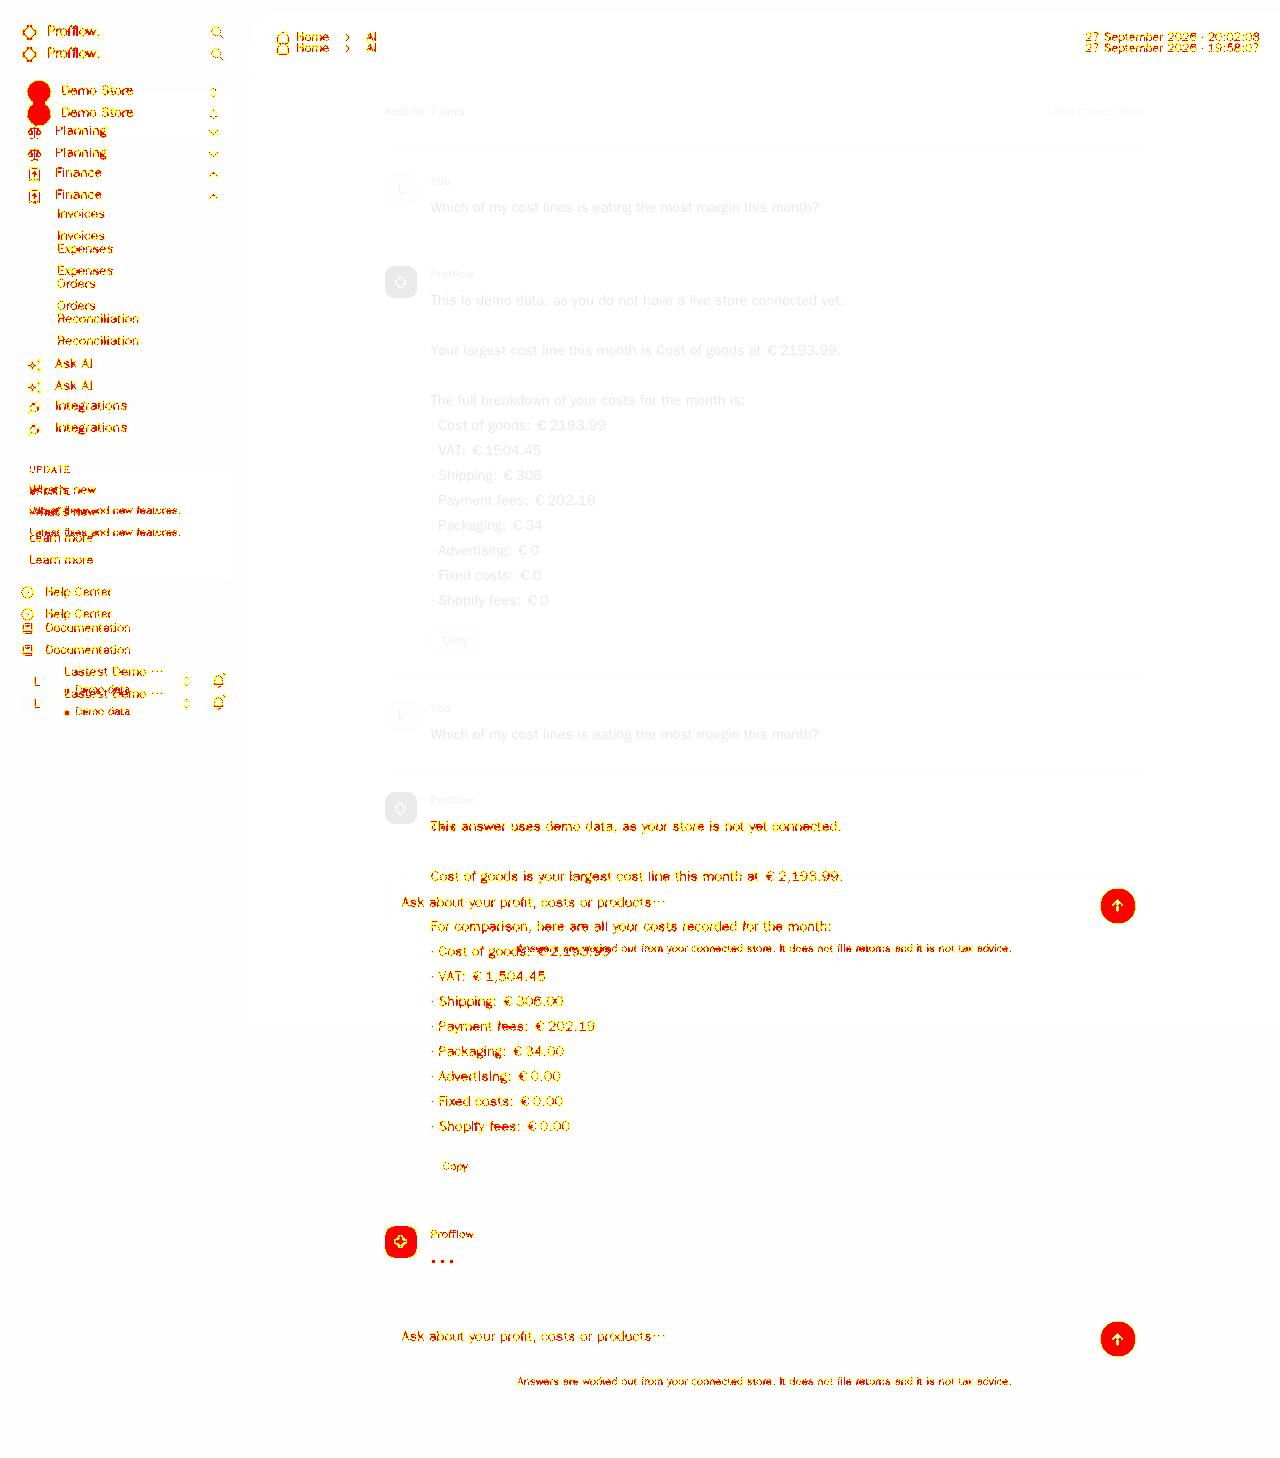
- Ask AI answers from the numbers on screenAsked which cost line eats the most margin, it returned Cost of goods at 2193.99 with the full ordered breakdown, not a generic paragraph.
- Figures explain their own workingsNet profit is drawn at the period margin, not recomputed per day, and payment fees are an estimate. Telling people where a figure is approximate is rarer than it should be.
- Order Profitability is empty while the dashboard shows 68 ordersFinance to Orders reads No orders in this period against the same range where the dashboard counts 68 sample orders. Feeding the demo orders into that table, or labelling it needs a live store, would stop it reading as a bug.
- No deep link to a dashboard viewDaily P&L, Break-Even and Forecast are role=tab buttons with no URL of their own, so the whole app is one /dashboard address. You cannot bookmark Break-Even or paste it to an accountant.
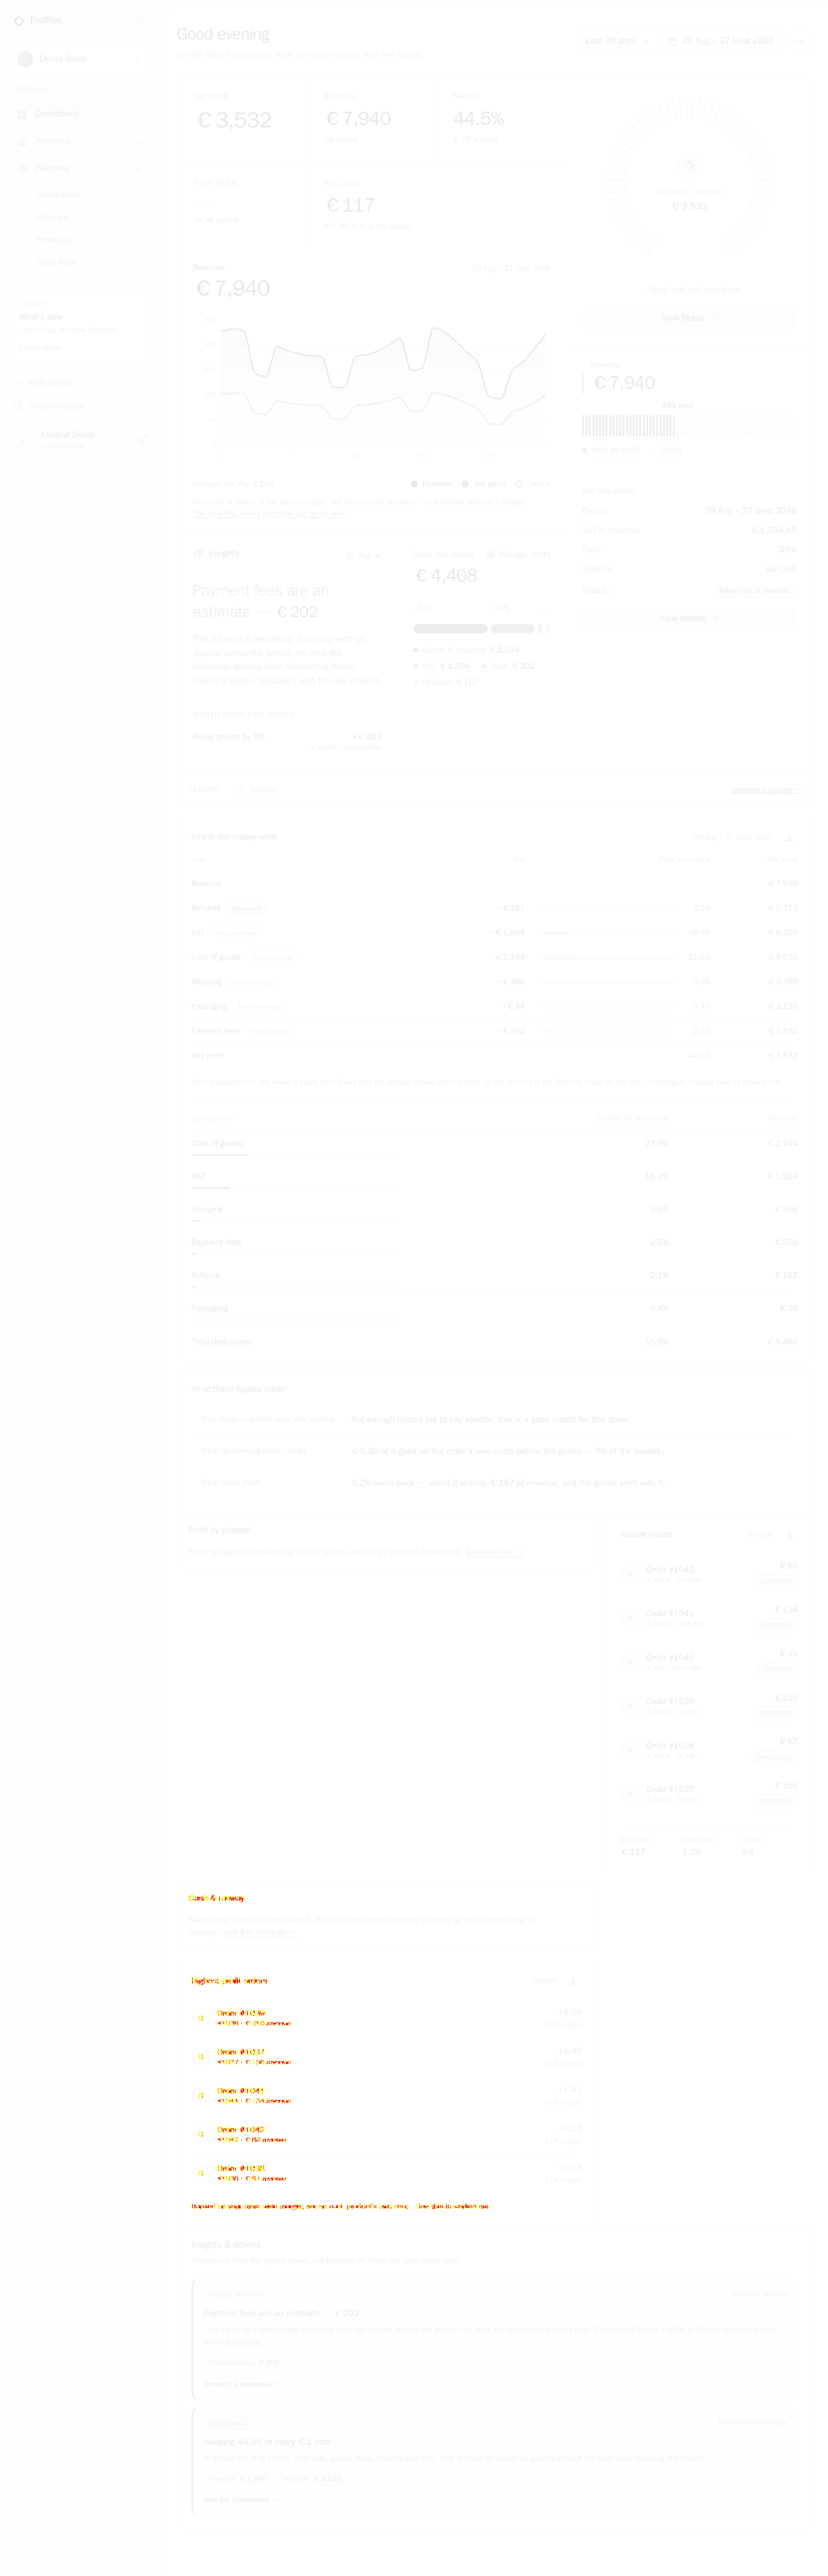
6 visual changes












Share this run
Proof your app is not AI slop
This test was built for www.profflow.co — claim it free
One click copies the test and baseline screenshots into your own Lastest workspace. Re-run on every deploy and catch regressions before your users do — free, no card required.