

In this video· click a step to jump to it
Test recording
Pingara — app walkthrough
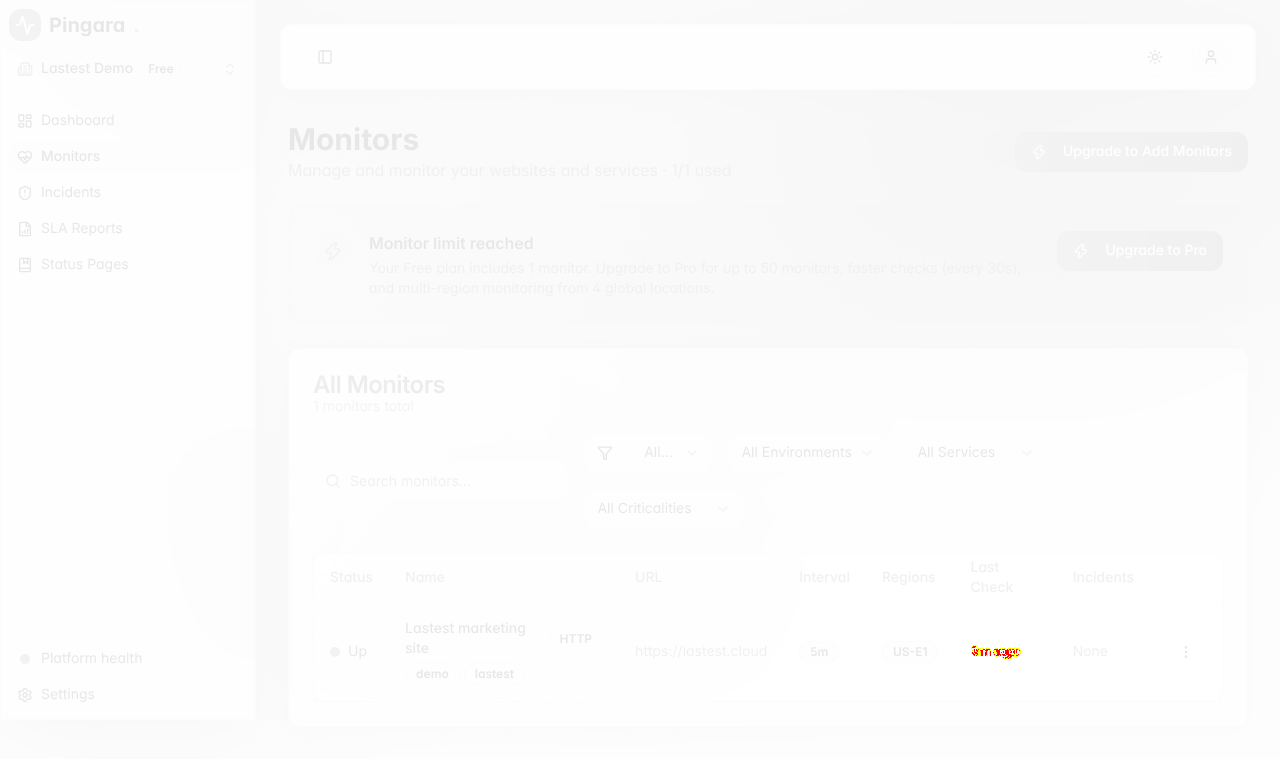
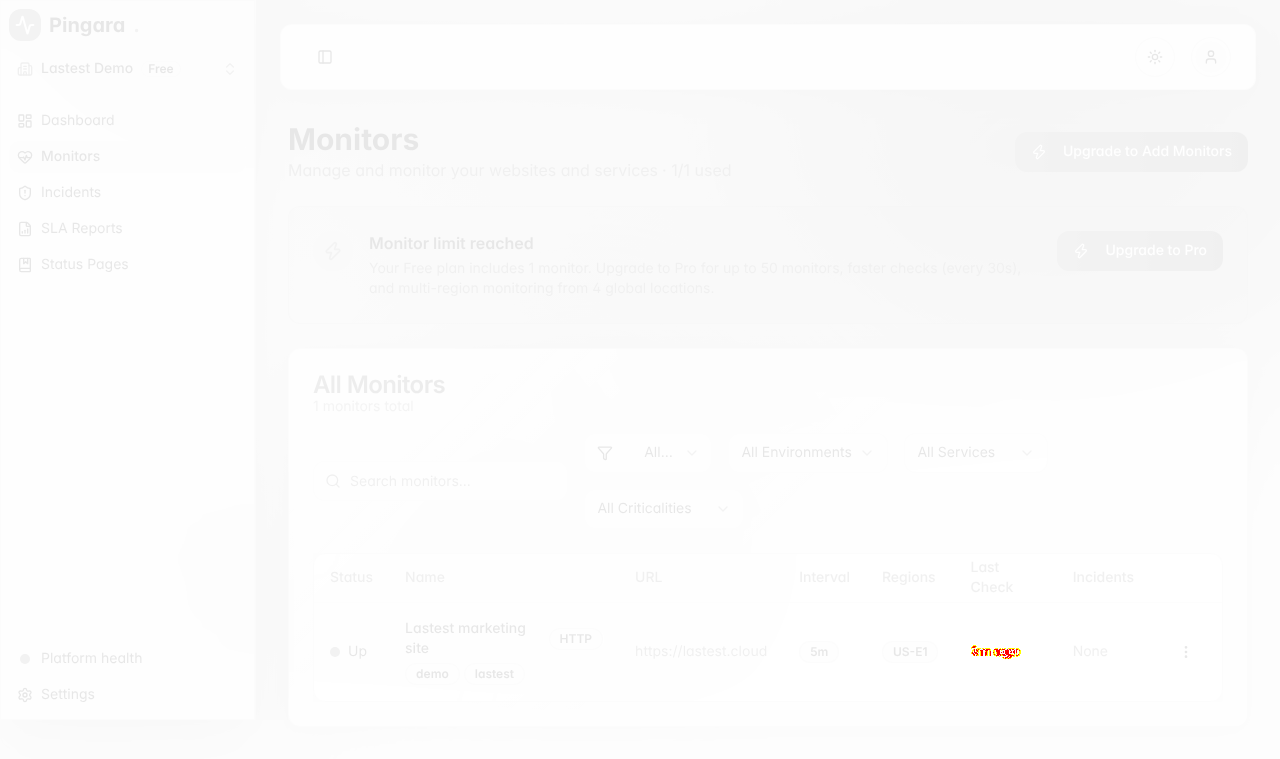
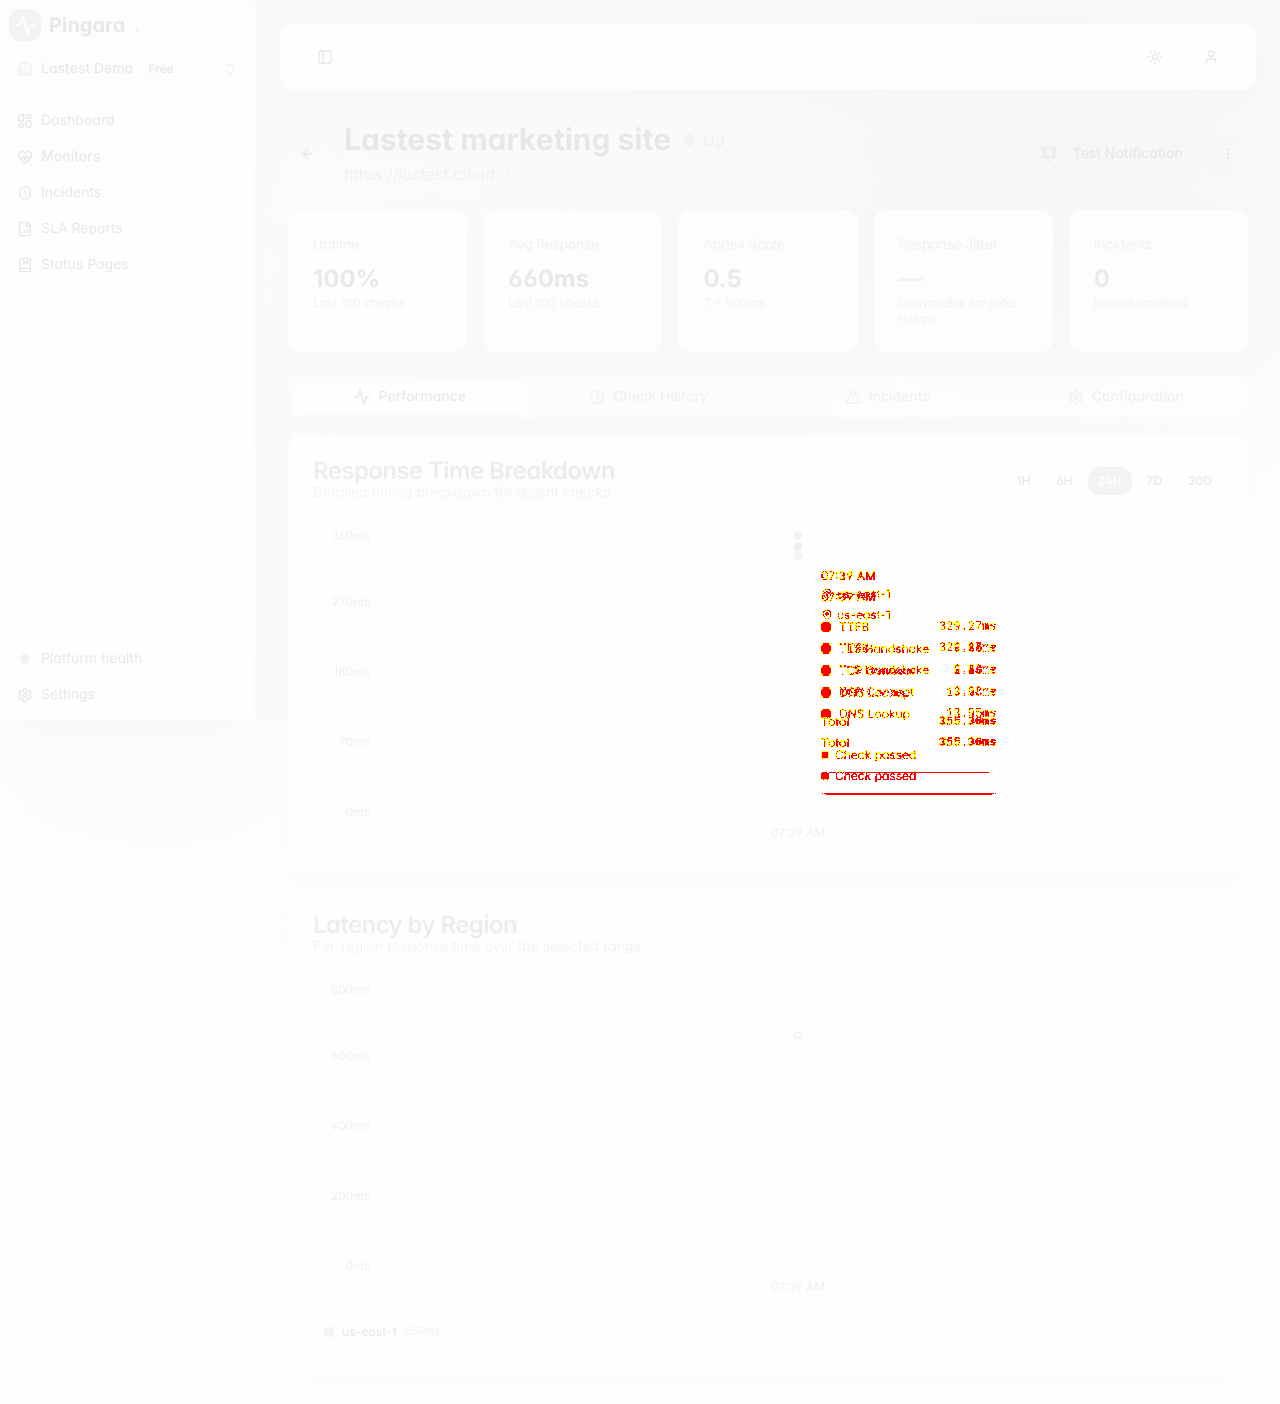
122,169 ms · 4,160 pixels changed
We built this regression test for www.pingara.io — it's yours to keep, free.
Take this test with you
This is a real Playwright test, recorded against www.pingara.io. Claim it into your own workspace and re-run it on every deploy — free.
export async function test(page, baseUrl, screenshotPath, stepLogger) {
  const shot = (n, slug) => screenshotPath.replace('.png', `-${n}-${slug}.png`);
  const SCROLL_THROUGH = "(async () => { const ease = t => 1 - Math.pow(1 - t, 3); const max = Math.max(0, document.body.scrollHeight - window.innerHeight); if (max < 40) return; const anim = (a, b, ms) => new Promise(res => { const t0 = performance.now(); const step = now => { const p = Math.min(1, (now - t0) / ms); window.scrollTo(0, a + (b - a) * ease(p)); p < 1 ? requestAnimationFrame(step) : res(); }; requestAnimationFrame(step); }); await anim(0, max, 1400); await new Promise(r => setTimeout(r, 350)); await anim(max, 0, 800); })()";
  const GATE = /welcome back|enter your credentials|forgot your password\?|create an account/i;
  const SETTLED = function () { const m = document.querySelector('main') || document.body; return m.innerText.length > 200; };
  let postLoginActions = 0;

  await page.context().setExtraHTTPHeaders({ 'User-Agent': 'Mozilla/5.0 (X11; Linux x86_64) AppleWebKit/537.36 (KHTML, like Gecko) Chrome/132.0.0.0 Safari/537.36' });

  // ── Scenario 1: public landing page ───────────────────────────────────────
  stepLogger.log('Scenario 1: Pingara landing page');
await page.goto(baseUrl + '/', { waitUntil: 'domcontentloaded' });Checks run
Notes from the demo run
AI-generatedWe registered on Pingara, verified by email, added a monitor on lastest.cloud and then drove the whole signed-in surface: dashboard, monitors and filters, the monitor detail, incidents, SLA reports, status pages, platform health and settings. Signup to a live monitor took under three minutes, and the dashboard already had uptime and an Apdex score on it by the time we came back to it.
- The monitor form is a real monitoring formHTTP, keyword, ping, TCP/UDP, DNS and WebSocket types, plus environment, service, criticality, Apdex threshold, slow-response thresholds, expected status codes and custom headers. Most free uptime tiers give you a URL box and nothing else.
- Apdex and SLA are first-class, not an upsell pageApdex score sits on the free dashboard next to uptime, and SLA Reports is a real nav item. That framing targets people who have to report uptime to someone else, which is a sharper wedge than 'we ping your site'.
- Free tier is honest about its edgesThe banner states 1 monitor, 5-minute checks, 1 region and what Pro changes. No dark-pattern discovery after setup.
- A new account is read-only until the email is verifiedThe dashboard renders with 'Until verified, you have read-only access', so the first thing a new user sees is a product they cannot use yet. Letting the first monitor be created immediately and verifying in the background would put the value first.
- Signup drops you at the login screen instead of the dashboardCreating an account redirects to /login?registered=true and asks for the credentials that were just typed. One free step to remove: sign the session in on registration.
3 visual changes






Share this run
Proof your app is not AI slop
This test was built for www.pingara.io — claim it free
One click copies the test and baseline screenshots into your own Lastest workspace. Re-run on every deploy and catch regressions before your users do — free, no card required.