

In this video· click a step to jump to it
Test recording
TiempoTracker — app walkthrough
161,825 ms · 495,245 pixels changed
We built this regression test for app.tiempotracker.com — it's yours to keep, free.
Take this test with you
This is a real Playwright test, recorded against app.tiempotracker.com. Claim it into your own workspace and re-run it on every deploy — free.
export async function test(page, baseUrl, screenshotPath, stepLogger) {
  const shot = (n, slug) => screenshotPath.replace('.png', '-' + n + '-' + slug + '.png');
  const UA = 'Mozilla/5.0 (X11; Linux x86_64) AppleWebKit/537.36 (KHTML, like Gecko) Chrome/132.0.0.0 Safari/537.36';
  await page.context().setExtraHTTPHeaders({ 'User-Agent': UA });

  for (const pattern of [
    '**/cdn-cgi/scripts/**/email-decode.min.js',
    '**/cdn-cgi/scripts/**/cloudflare-static/**',
    '**/browser.sentry-cdn.com/**',
    '**/cdn.segment.com/**',
    '**/connect.facebook.net/**',
'**/www.googletagmanager.com/**',Checks run
Notes from the demo run
AI-generatedWe registered on TiempoTracker, seeded a client, a project and three days of work, then drove the whole app end-to-end: time log, search, the Add Time composer, dashboard, clients, projects, reports, invoices and billing. The thing that stands out is how little ceremony there is between signing up and having a billable number on screen: your Add Time dialog asks for client, project, date and duration and nothing else, and the rate cascade (client default, project override) fills the money in for you. Reports agreed with the Time page to the minute and the cent, which is not a given in time-tracking tools.
- Rate cascade just worksSetting a $95 client rate and a $110 project rate meant every entry priced itself. Three entries, 12h 45m, $1,211.25 on Reports with no manual maths.
- Getting Started tracks real progressThe 5-step checklist ticked off Add a Client, Create a Project, Track Your First Entry and View Your Work History as we actually did them, not on a timer. That is the honest version of onboarding.
- Filters are stateful per pageThe Time page remembered its filter state across navigation (sessionStorage page-state keys), so coming back from Reports did not dump our date range.
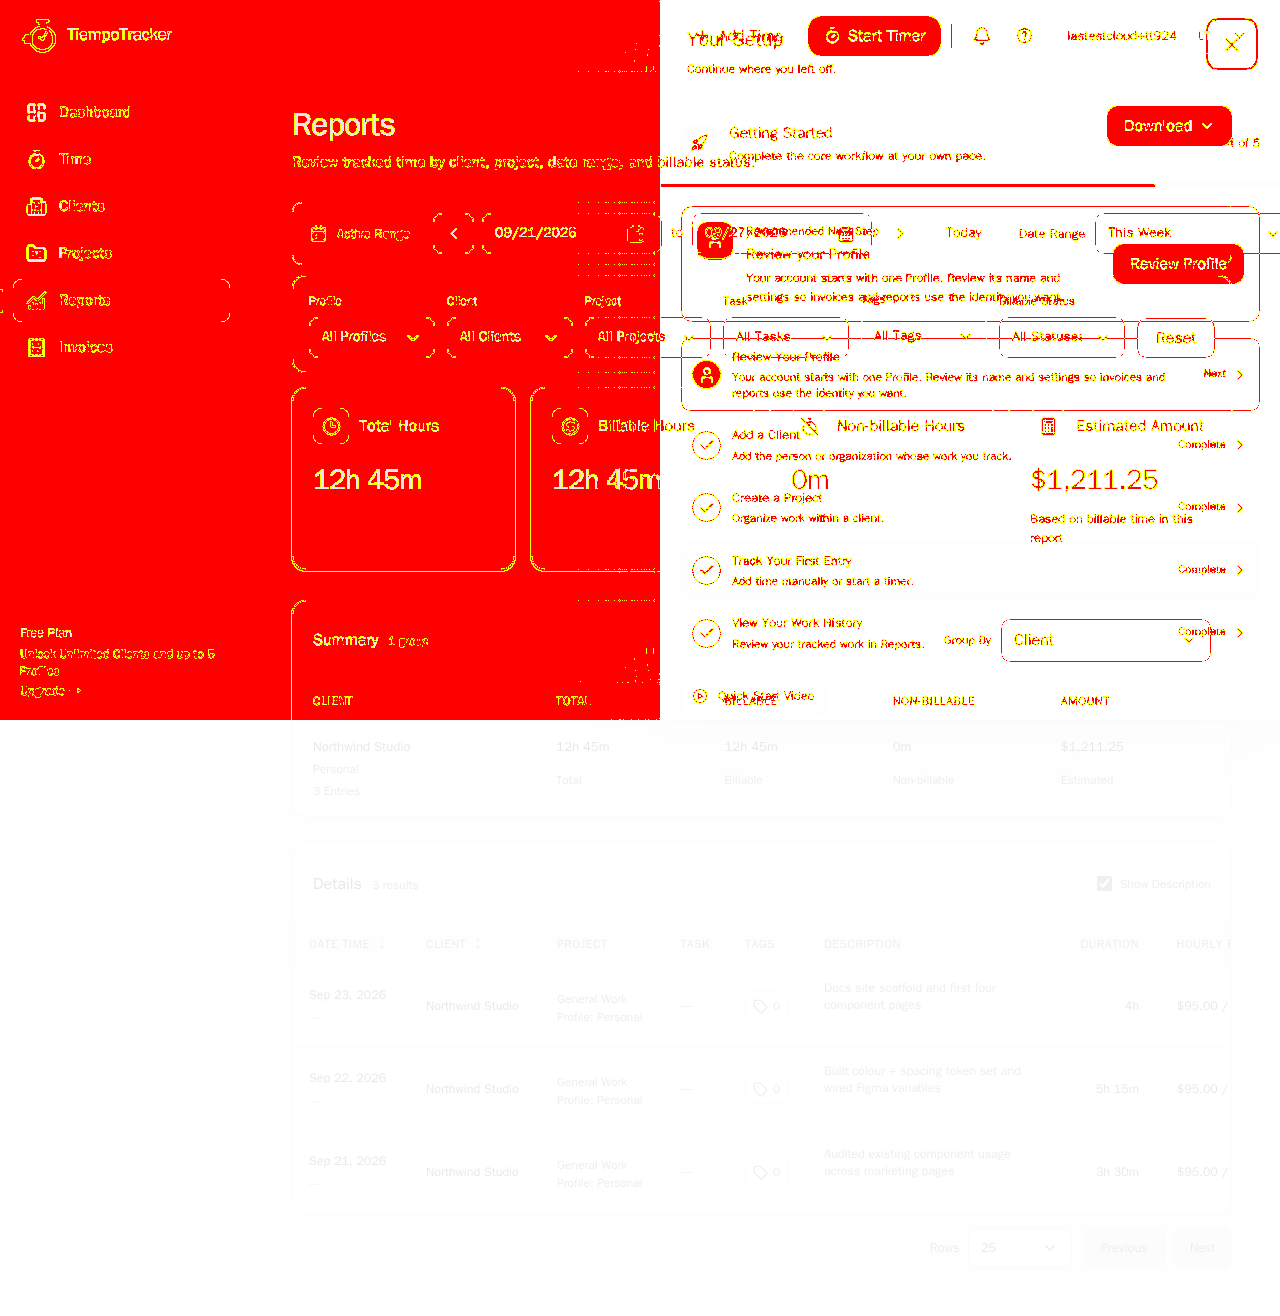
- Your Setup panel reopens over the contentOn /app/reports the Getting Started drawer auto-opened and covered the right half of the page, including the Estimated Amount tile. It reopened even after we dismissed it earlier in the session. Worth gating the auto-open on a persisted per-user flag rather than per-step progress.
- Client address fields are collapsed with no affordanceIn Add Client, the address inputs exist in the DOM but are not visible and there is no visible disclosure control to expand them, so a visitor filling in billing details cannot reach city/postcode. One expandable Billing address section would fix it.
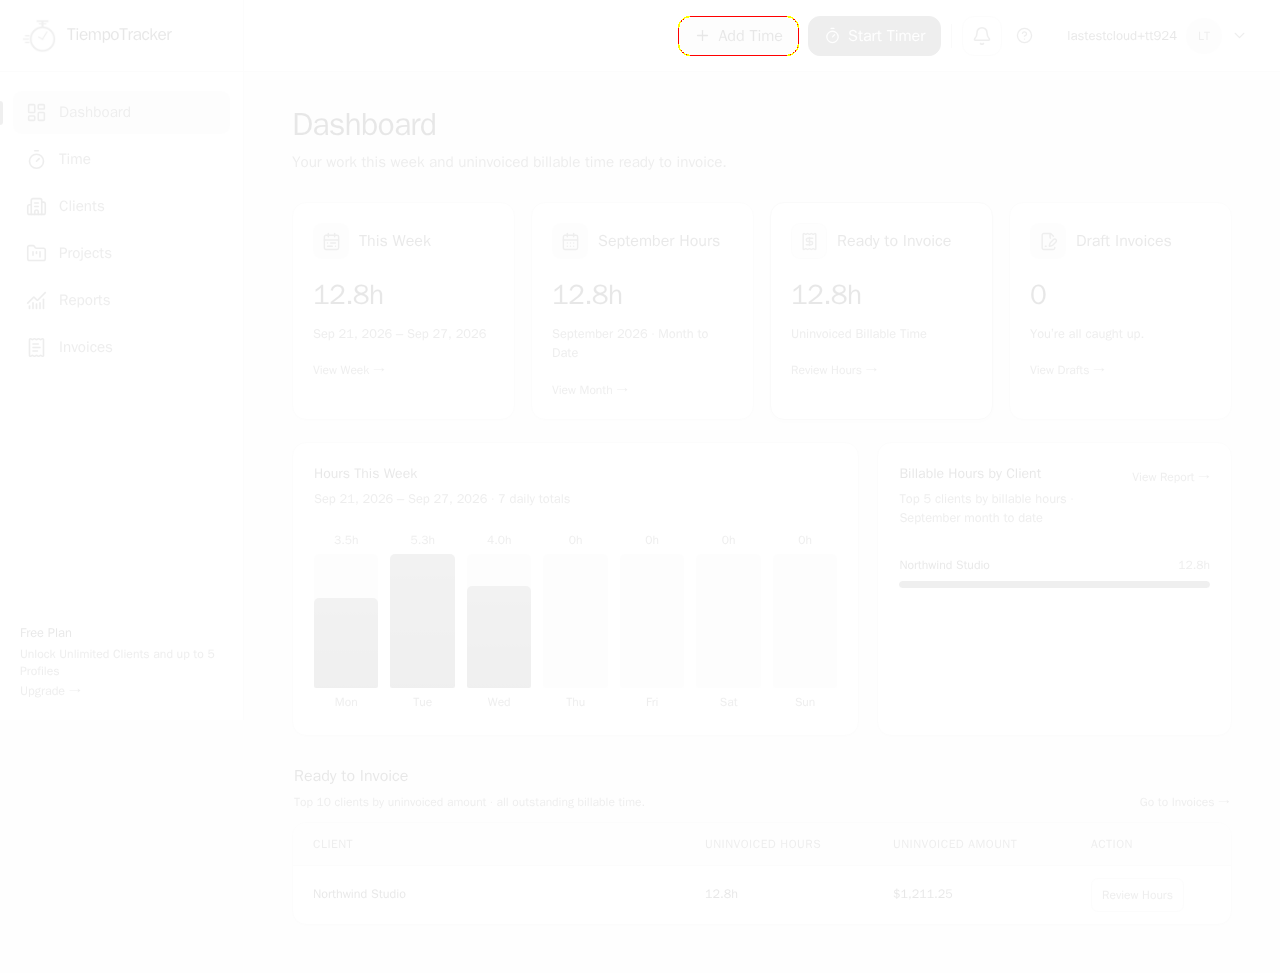
2 visual changes




Share this run
Proof your app is not AI slop
This test was built for app.tiempotracker.com — claim it free
One click copies the test and baseline screenshots into your own Lastest workspace. Re-run on every deploy and catch regressions before your users do — free, no card required.