

In this video· click a step to jump to it
Test recording
Mixdive — app walkthrough
93,746 ms · 4,787 pixels changed
We built this regression test for demo1.mixdive.com — it's yours to keep, free.
Take this test with you
This is a real Playwright test, recorded against demo1.mixdive.com. Claim it into your own workspace and re-run it on every deploy — free.
export async function test(page, baseUrl, screenshotPath, stepLogger) {
  const shot = (n, slug) => screenshotPath.replace('.png', '-' + n + '-' + slug + '.png');
  const UA = 'Mozilla/5.0 (X11; Linux x86_64) AppleWebKit/537.36 (KHTML, like Gecko) Chrome/132.0.0.0 Safari/537.36';
  await page.context().setExtraHTTPHeaders({ 'User-Agent': UA });

  for (const pattern of [
    '**/www.googletagmanager.com/**',
    '**/region1.analytics.google.com/**',
    '**/browser.sentry-cdn.com/**',
  ]) {
    await page.route(pattern, r => r.abort()).catch(() => {});
}Checks run
Notes from the demo run
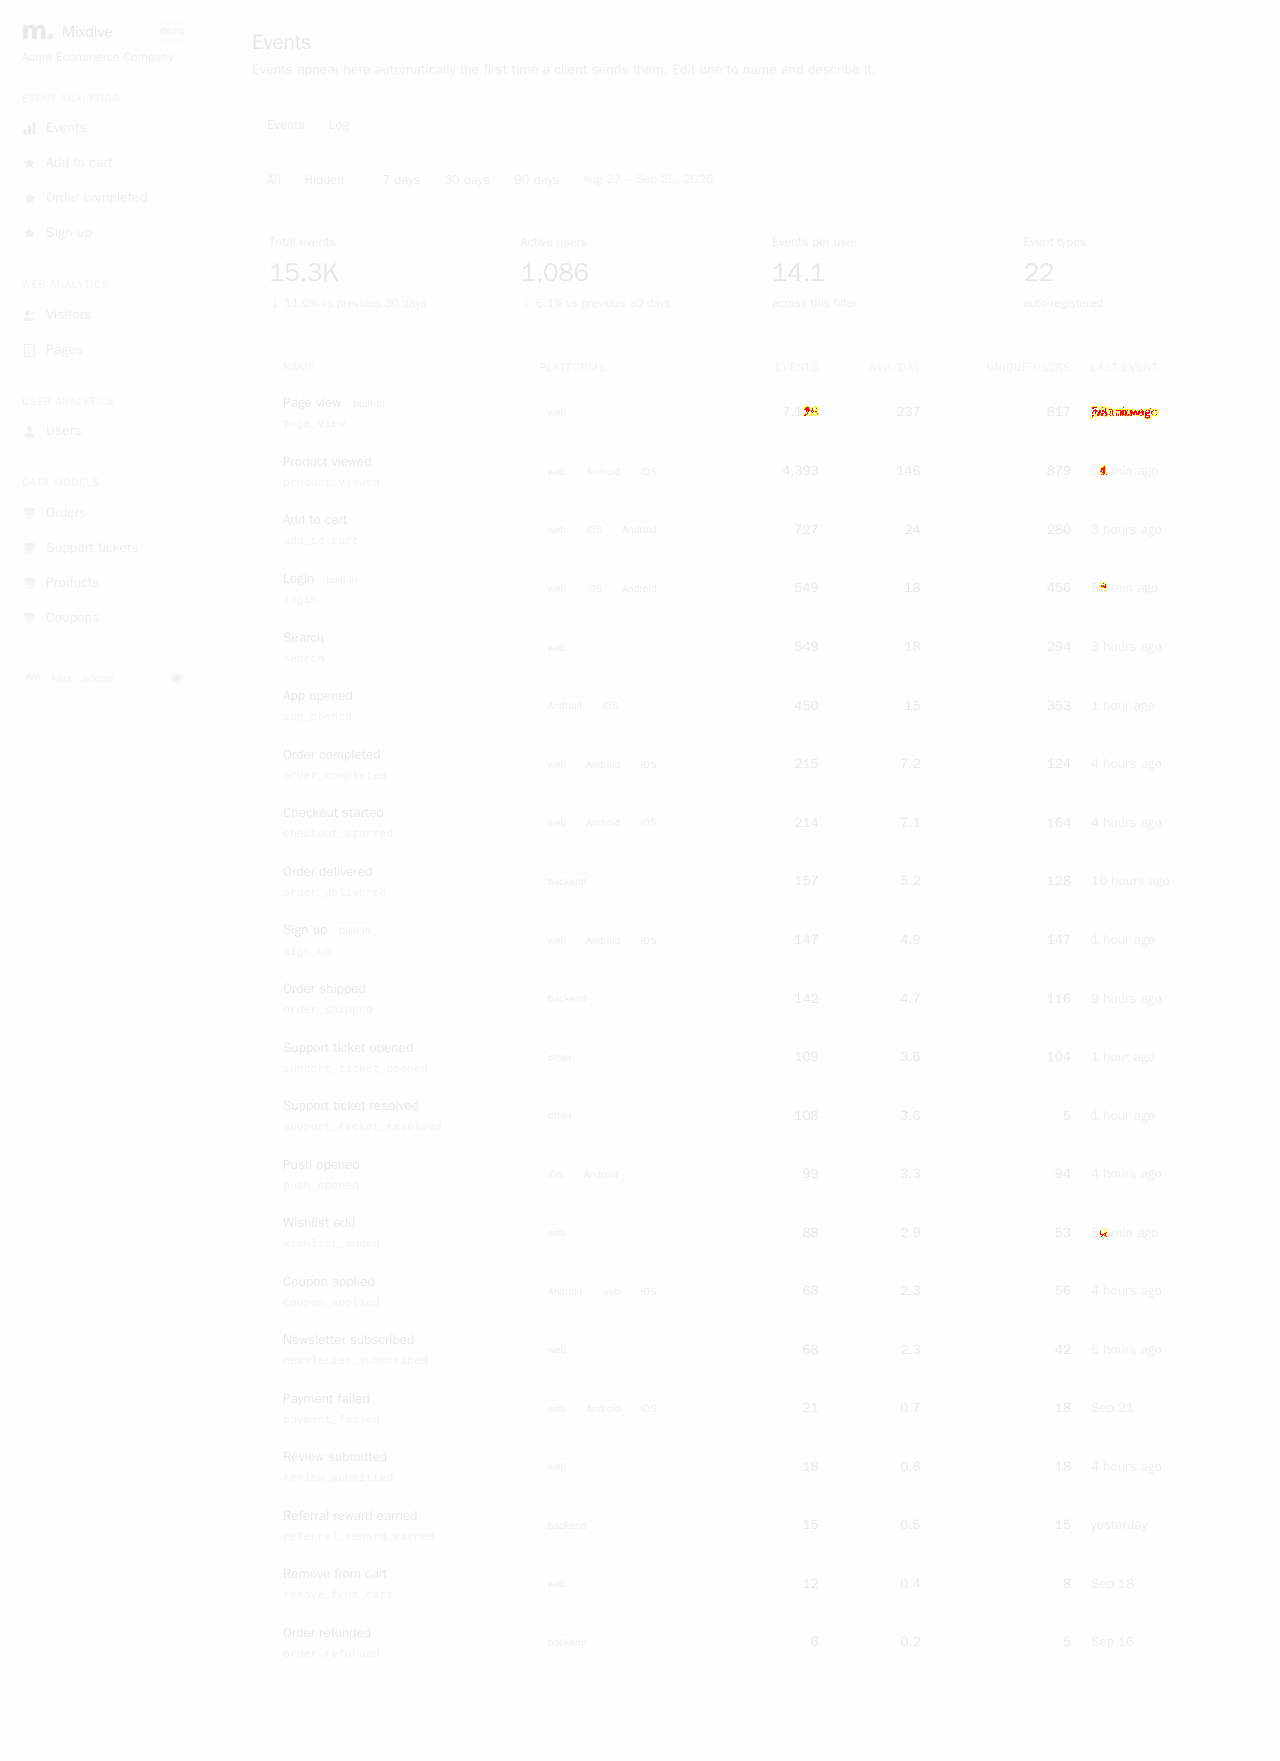
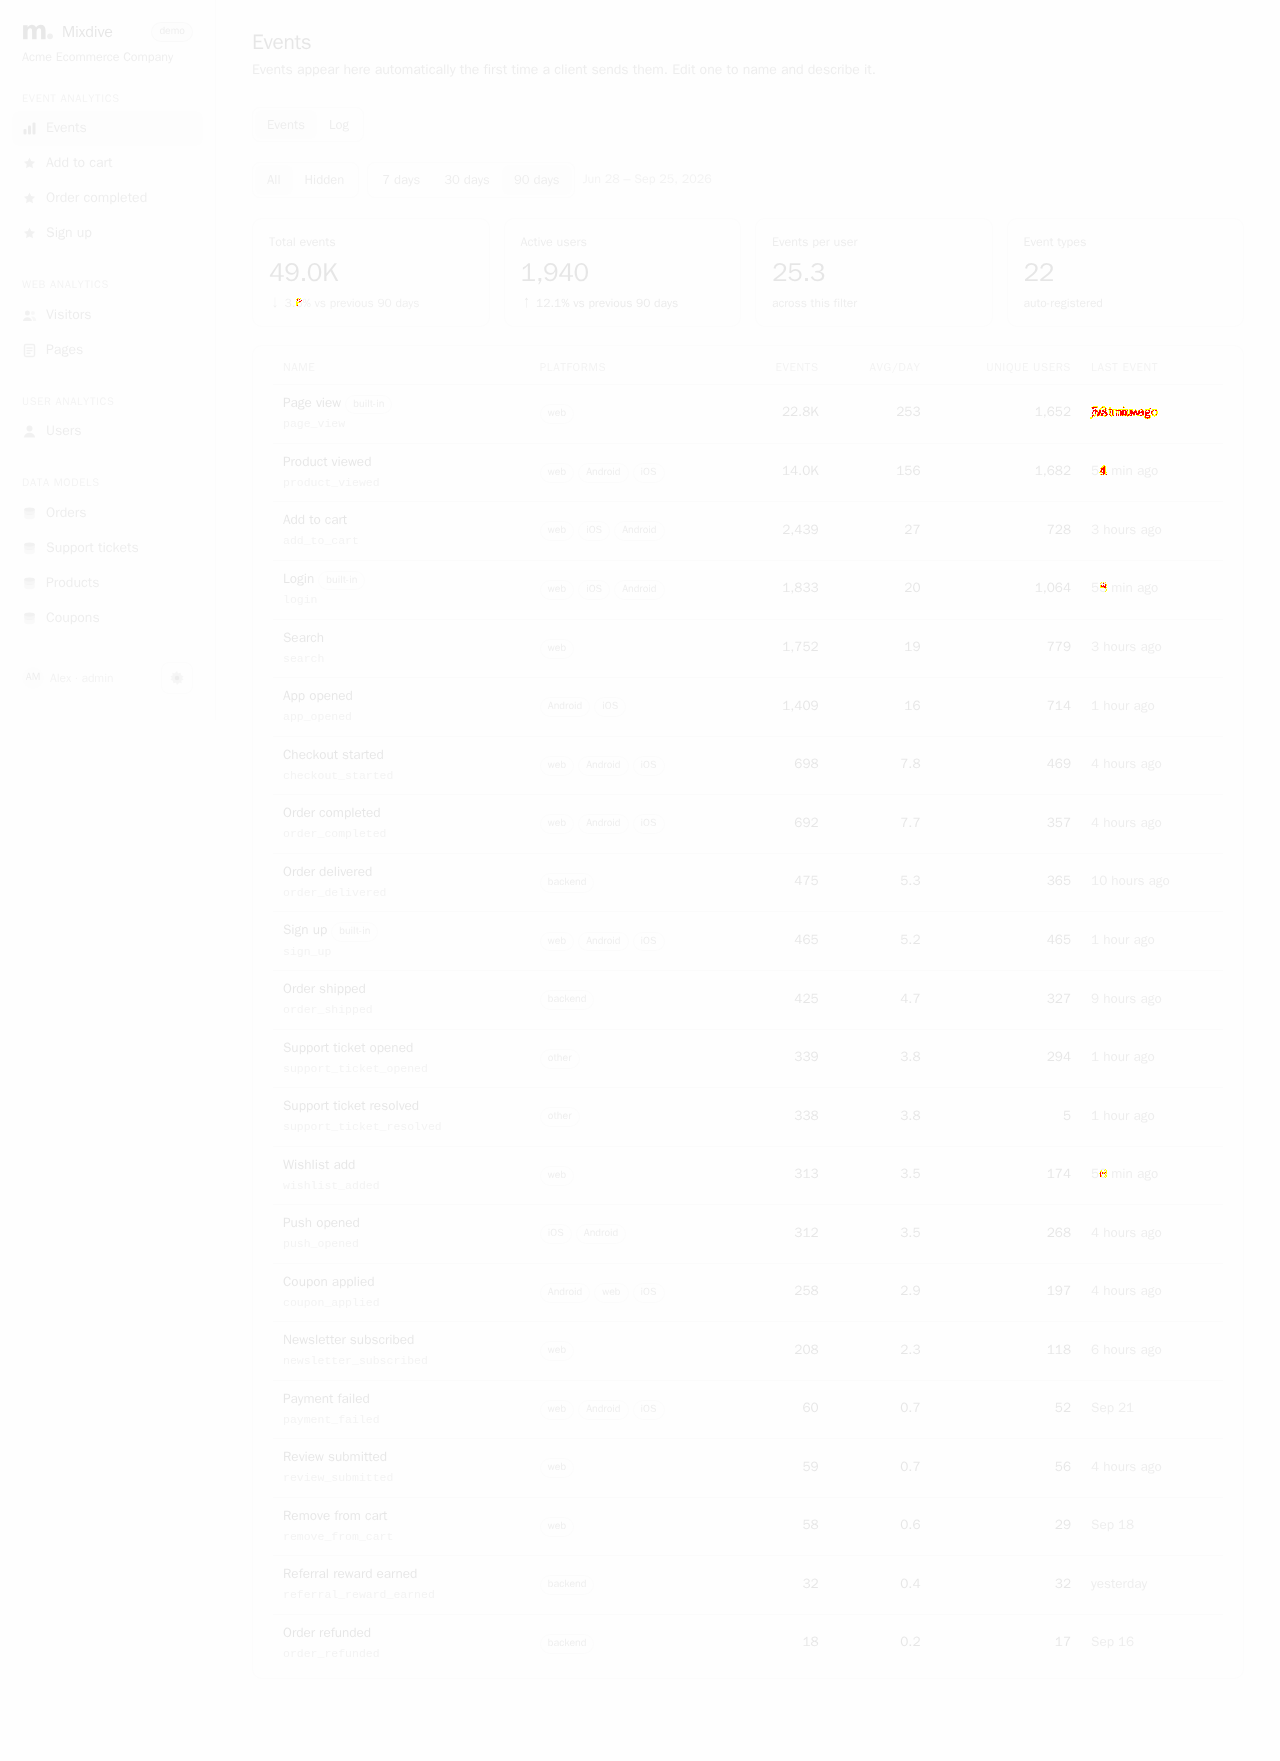
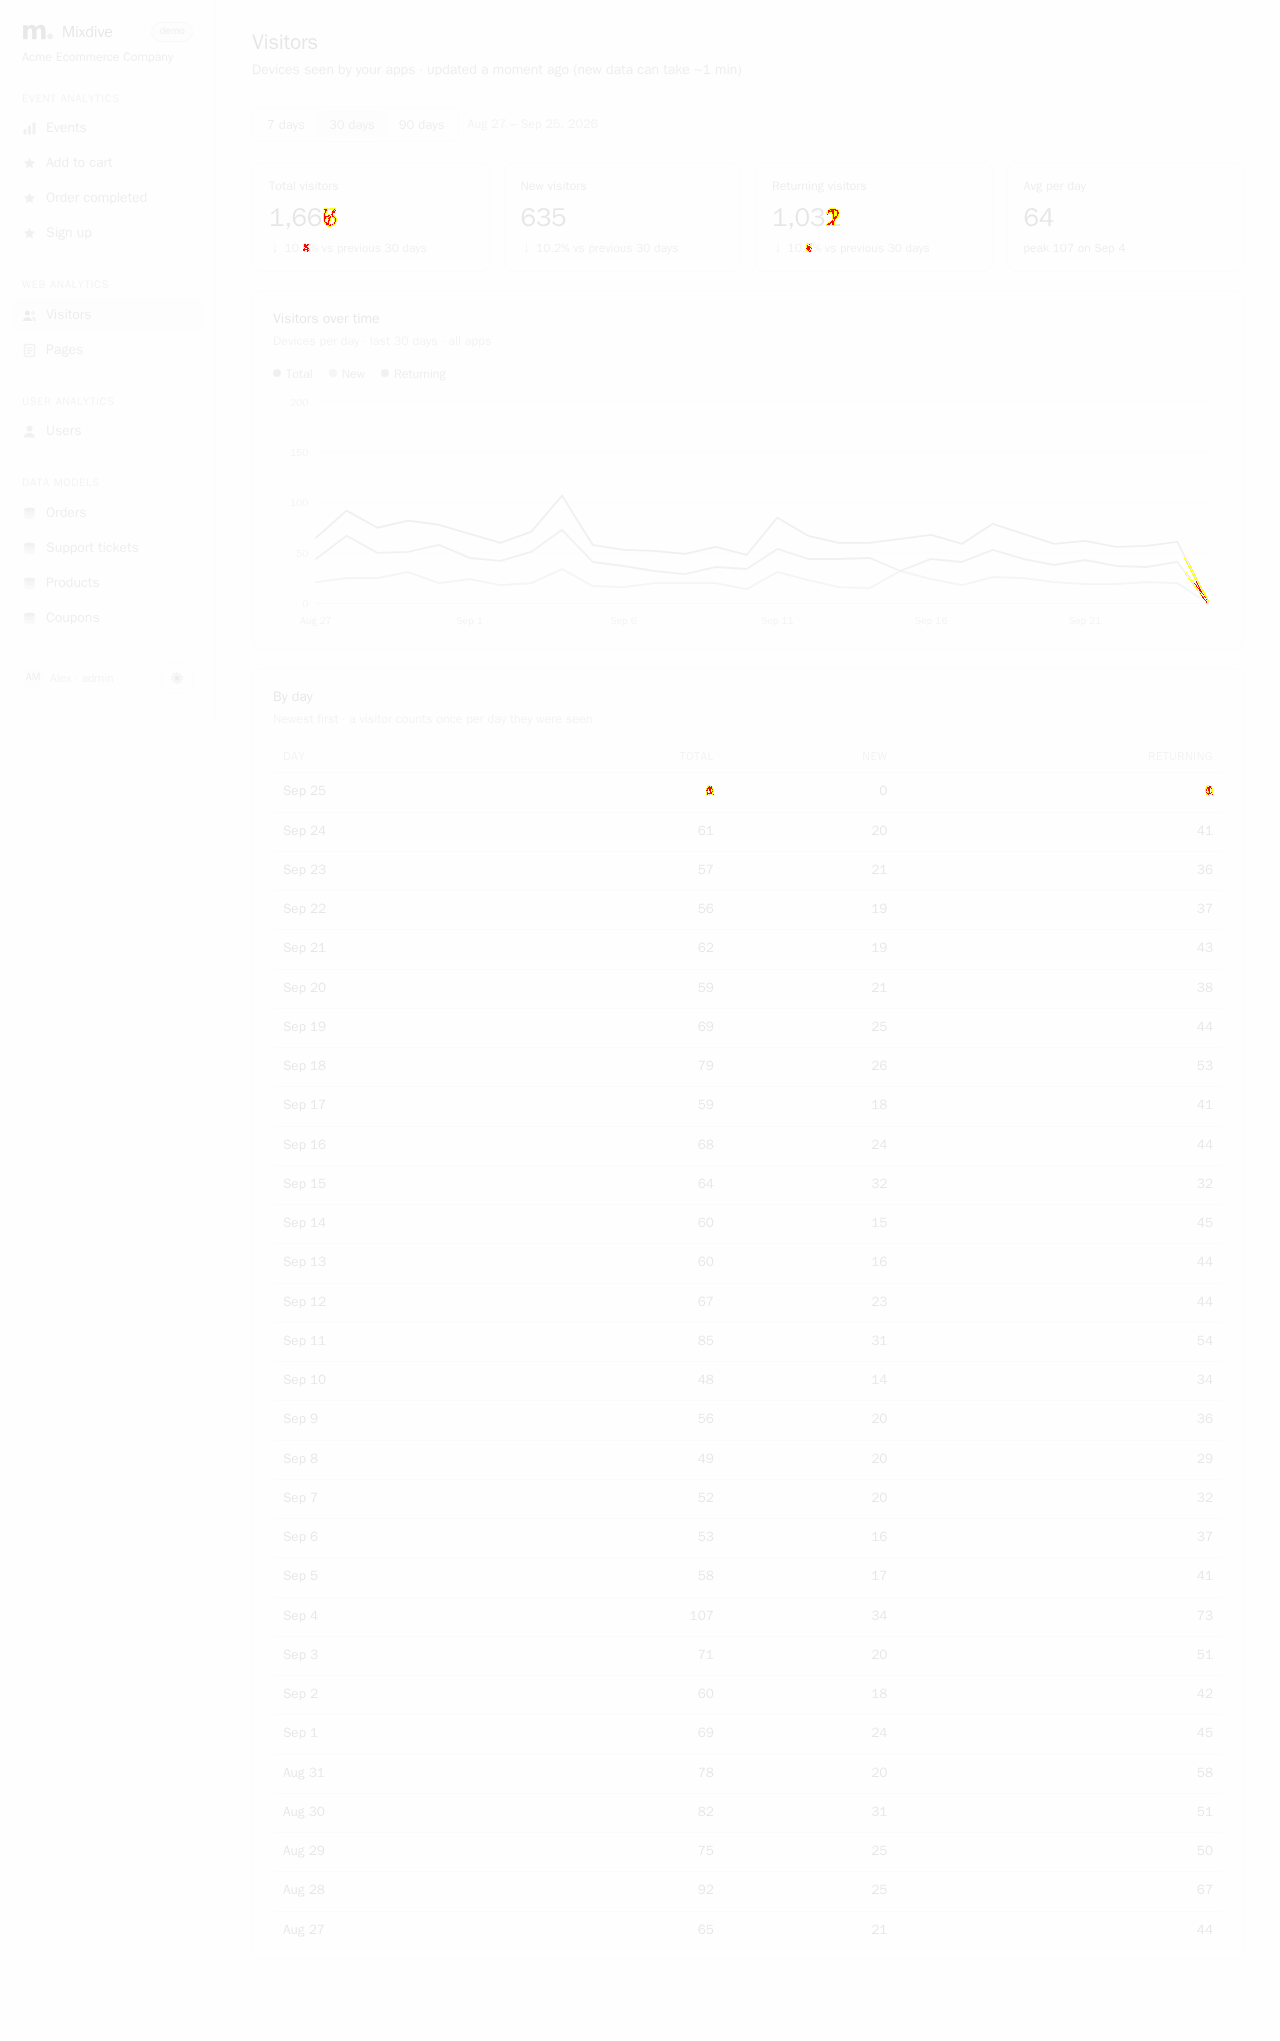
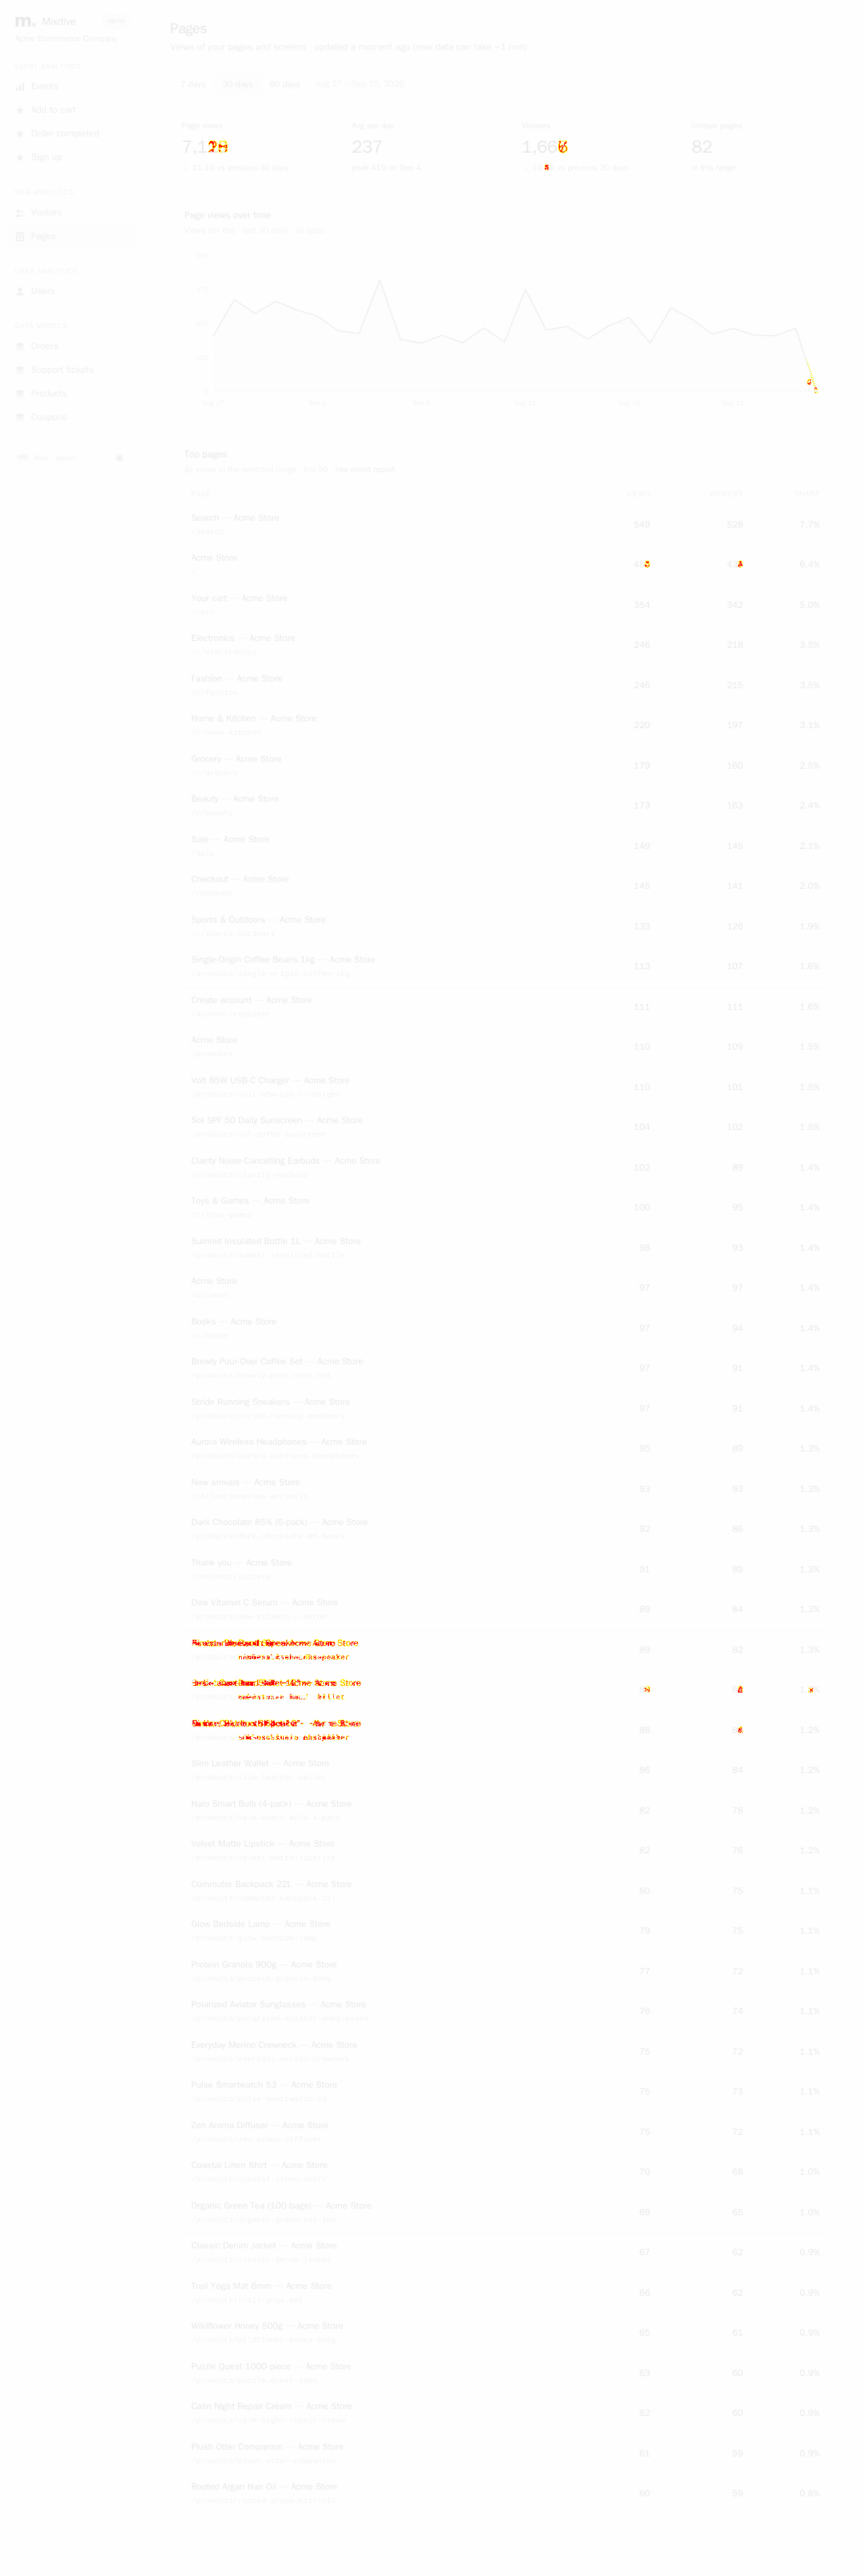
AI-generatedWe ran your own published demo instance end to end - signed in as Alex Morgan and walked Events, the 90-day range, two event drilldowns, Visitors, Pages, Users and three data models. The demo is the most persuasive thing on the site and it is doing real work: 15.3K events, 1,086 active users, 22 auto-registered event types, and a 22-row event table with per-platform badges and last-seen timestamps. Anyone evaluating a self-hosted analytics tool can answer 'what does this actually look like with data in it' in about ten seconds, without signing up for anything.
- The demo instance is the best sales asset you haveA one-click account picker (Alex admin / Priya admin / Sam user) that pre-fills the form, on read-only data, with three roles so a visitor can see permission differences. Most self-hosted tools make you run docker compose before you see a single chart.
- Events auto-register rather than needing definition upfront'Events appear here automatically the first time a client sends them. Edit one to name and describe it.' 22 types registered themselves, with built-in badges distinguishing page_view and login from custom events. That removes the tracking-plan chore that kills adoption on competing tools.
- Platform badges per event are a quiet standoutadd_to_cart showing web / iOS / Android, order_shipped showing backend only. At a glance you can see which surfaces actually emit an event - a genuinely useful debugging signal that Mixpanel buries.
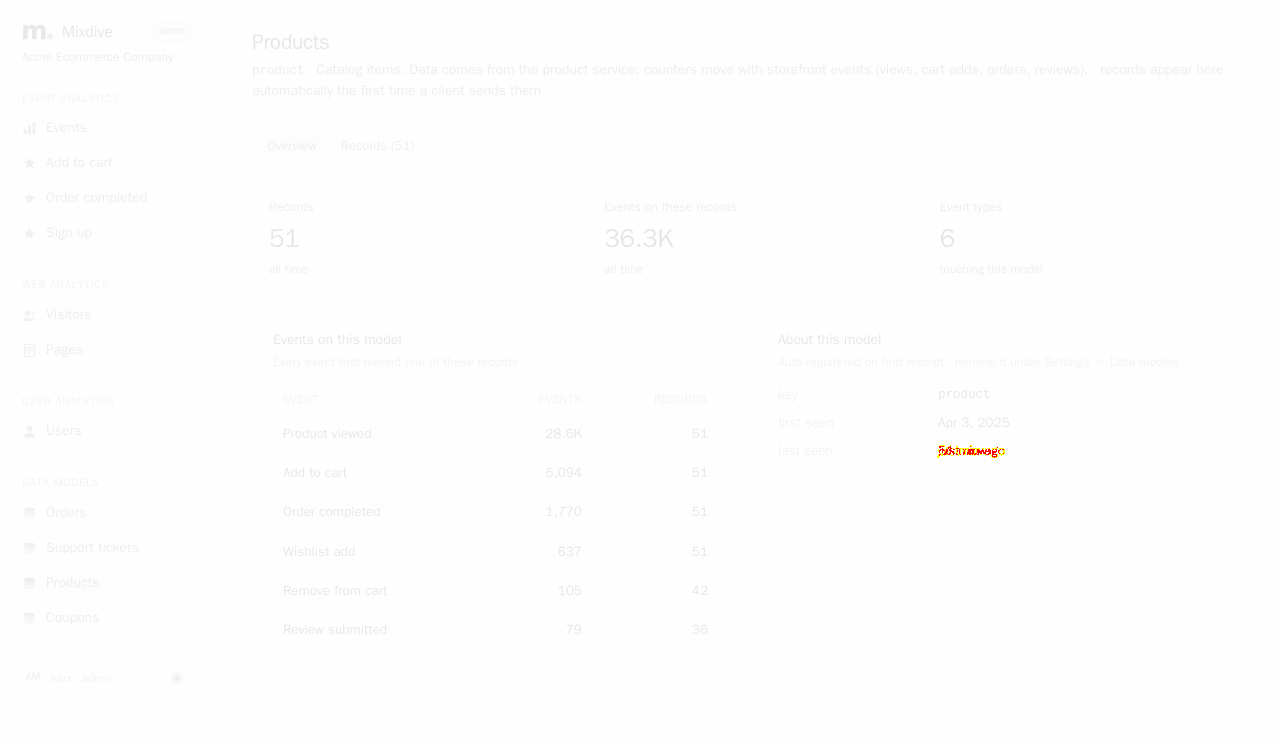
- Data models sit alongside event analyticsOrders, Support tickets, Products and Coupons as first-class sections rather than a separate BI tool. For an ecommerce team that is the difference between one tab and three.
- The demo is hard to find from the landing pagedemo1.mixdive.com is linked as a small 'Demo' item in the nav next to Docs, and the hero CTA points at Download instead. The demo answers the buying question far faster than the download does - promoting it to the hero as a second button next to Download would likely convert better than any copy change.
- Headline deltas are red without contextTotal events shows a red down-11.0% and Active users a red down-6.1% versus the previous 30 days. On a demo dataset that reads as 'this product's numbers are falling' to a first-time visitor rather than as sample data. A small 'sample data' caption near the deltas would stop the accidental negative signal.
7 visual changes
















Share this run
Proof your app is not AI slop
This test was built for demo1.mixdive.com — claim it free
One click copies the test and baseline screenshots into your own Lastest workspace. Re-run on every deploy and catch regressions before your users do — free, no card required.