

In this video· click a step to jump to it
Test recording
Watchlings — app walkthrough
70,622 ms · 30,542 pixels changed
We built this regression test for watchlings.vercel.app — it's yours to keep, free.
Take this test with you
This is a real Playwright test, recorded against watchlings.vercel.app. Claim it into your own workspace and re-run it on every deploy — free.
export async function test(page, baseUrl, screenshotPath, stepLogger) {
  const STAMP = Date.now().toString(36);
  let n = 0;
  const shot = async (slug) => {
    n += 1;
    await page.waitForTimeout(700);
    await page.screenshot({ path: `${screenshotPath}/Step_${n}_${slug}.png`, fullPage: true });
    stepLogger.log('captured ' + slug);
  };

  stepLogger.log('Authed 1: dashboard');
await page.goto(baseUrl + '/', { waitUntil: 'domcontentloaded' });Checks run
Notes from the demo run
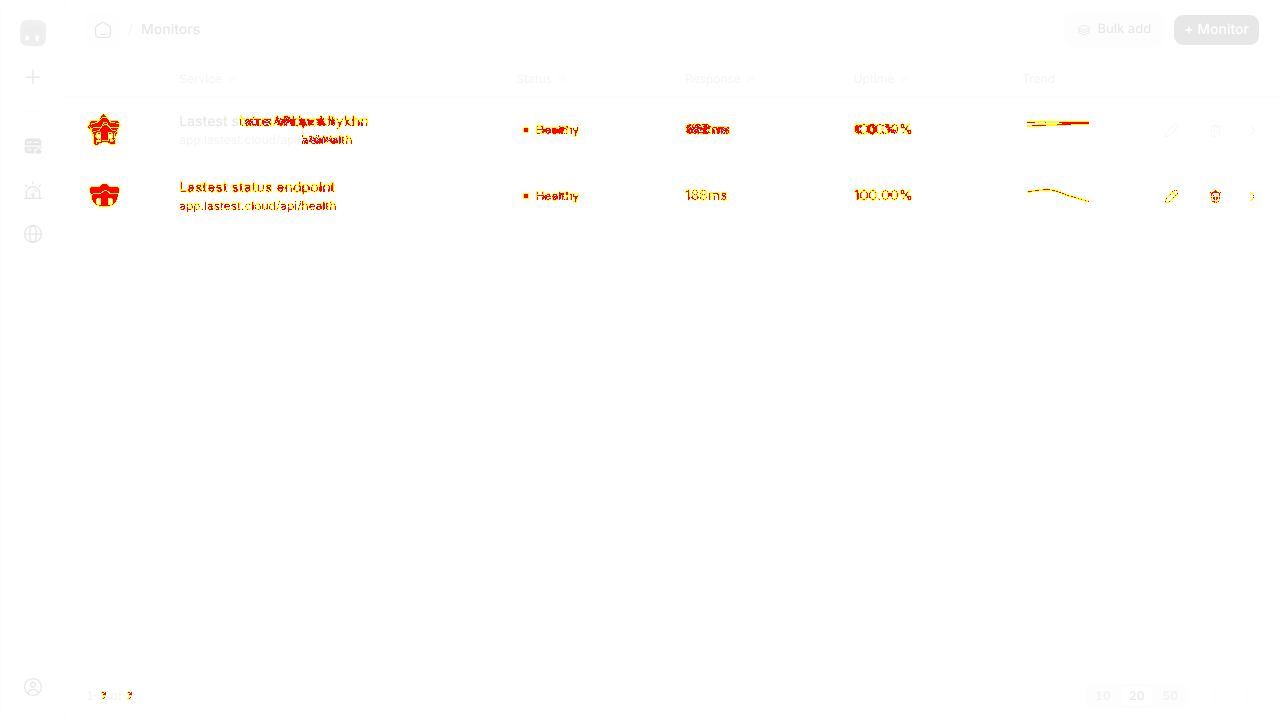
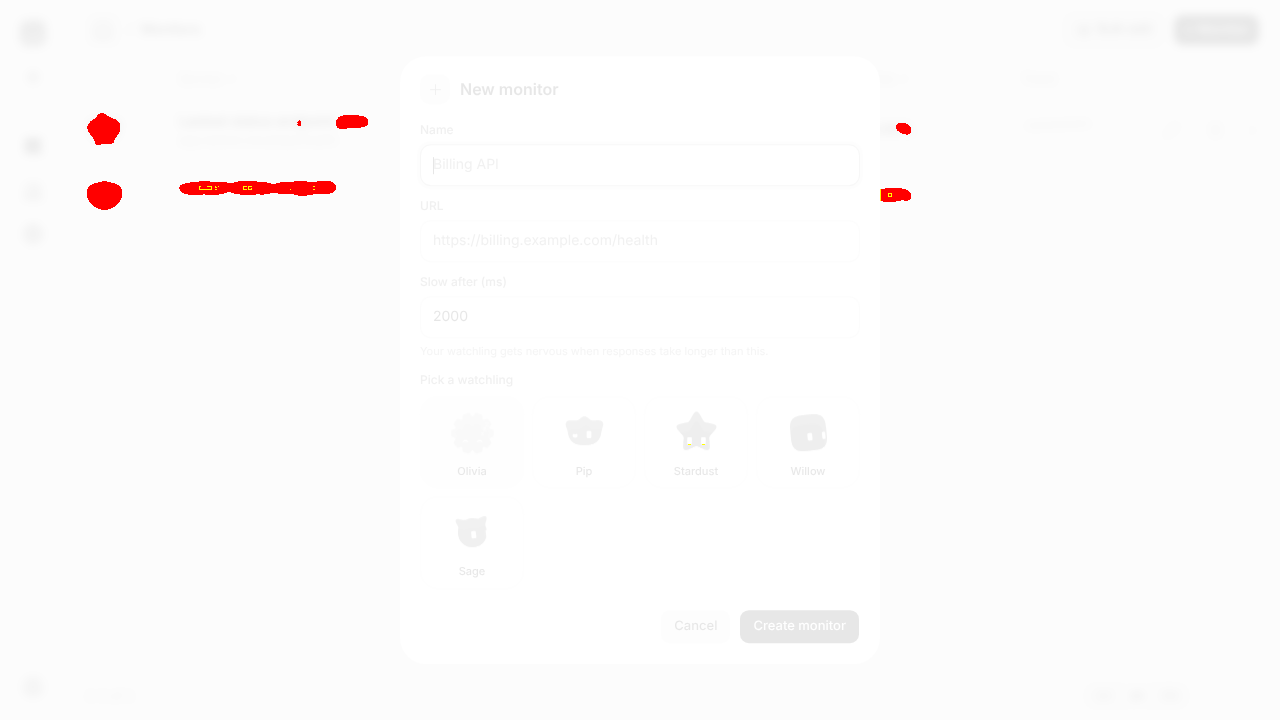
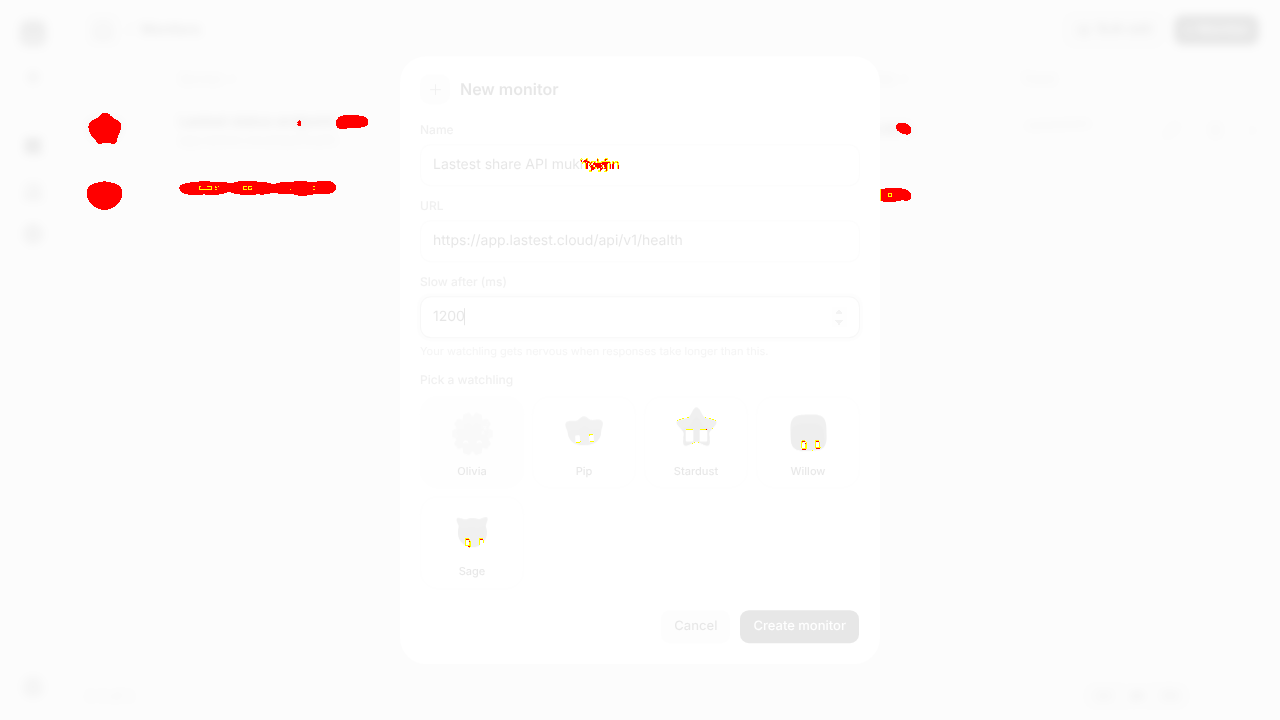
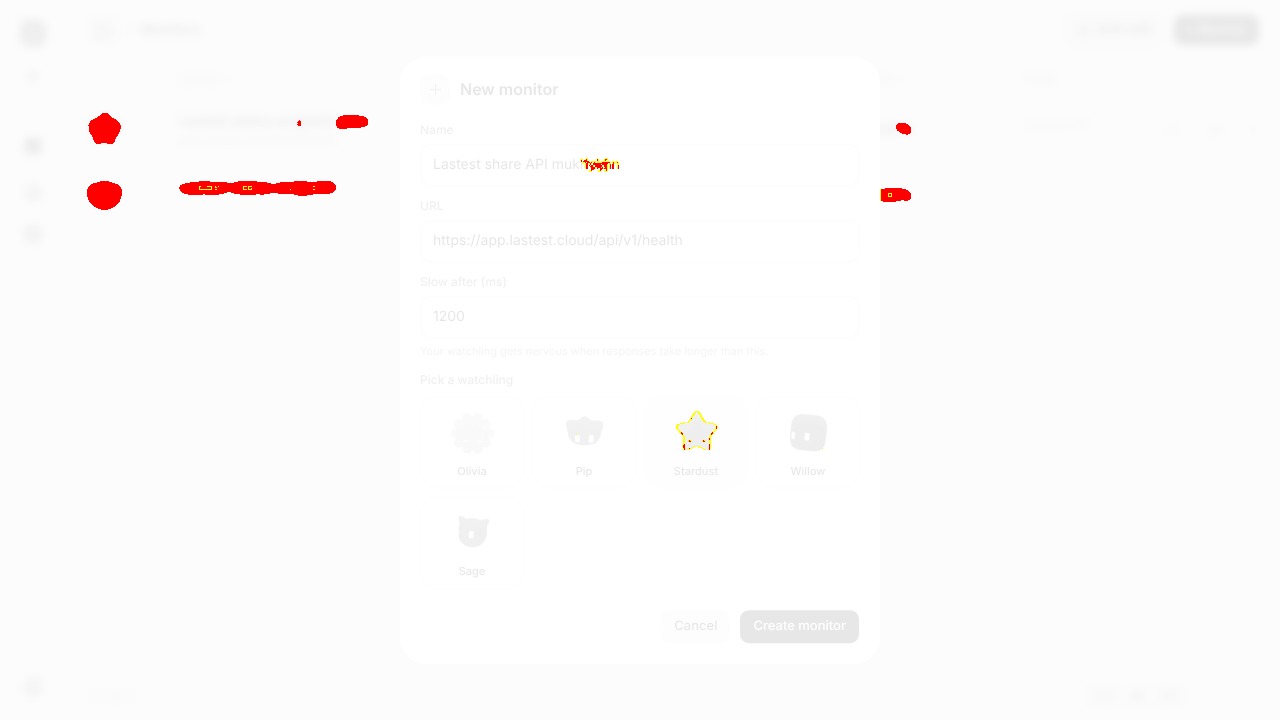
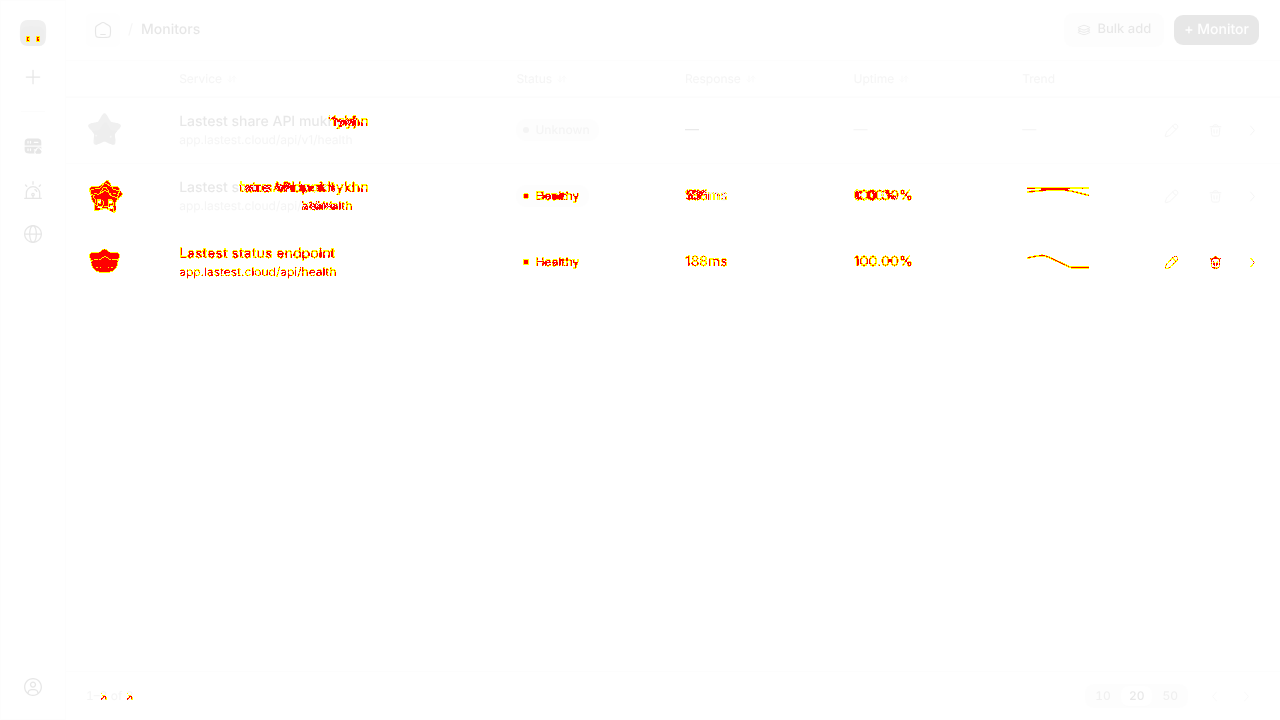
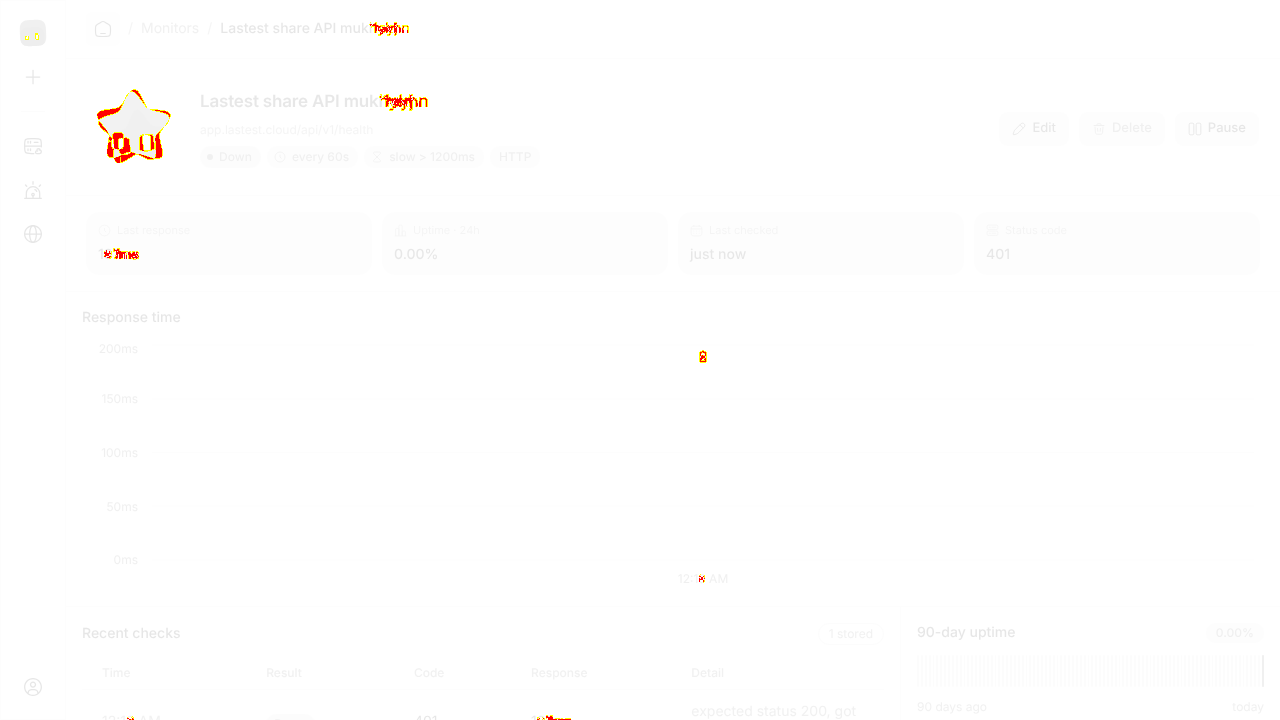
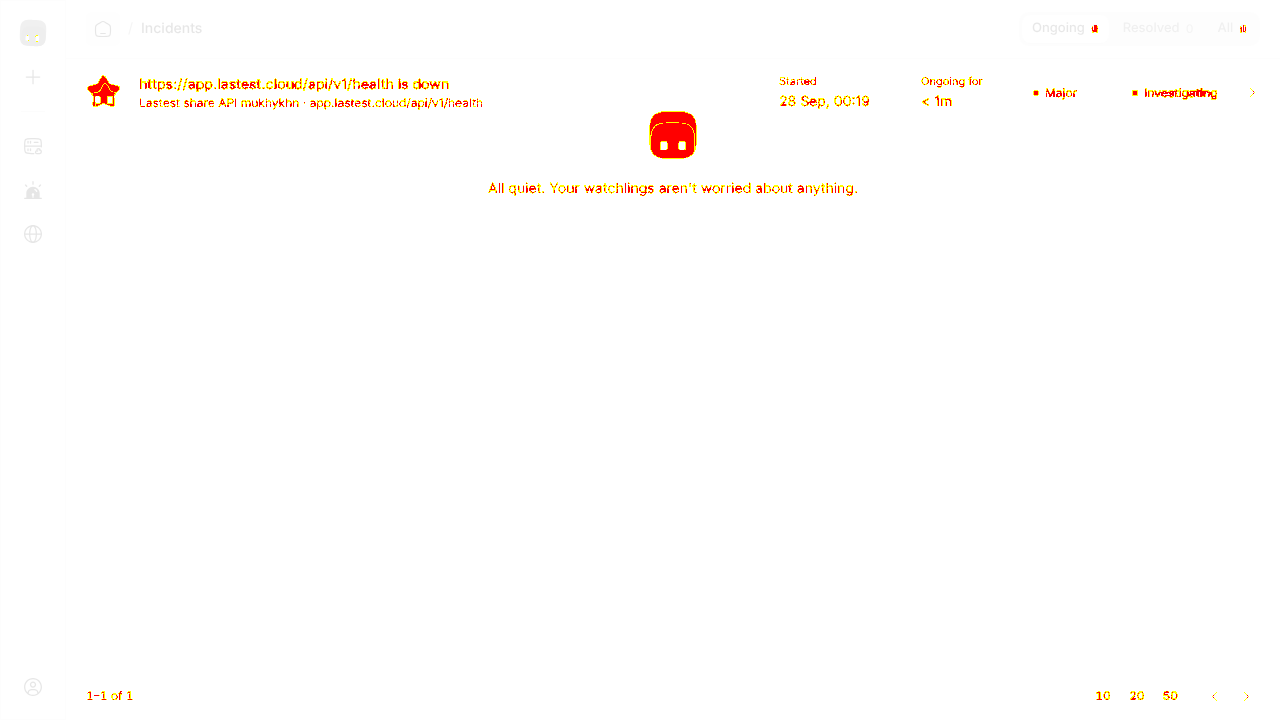
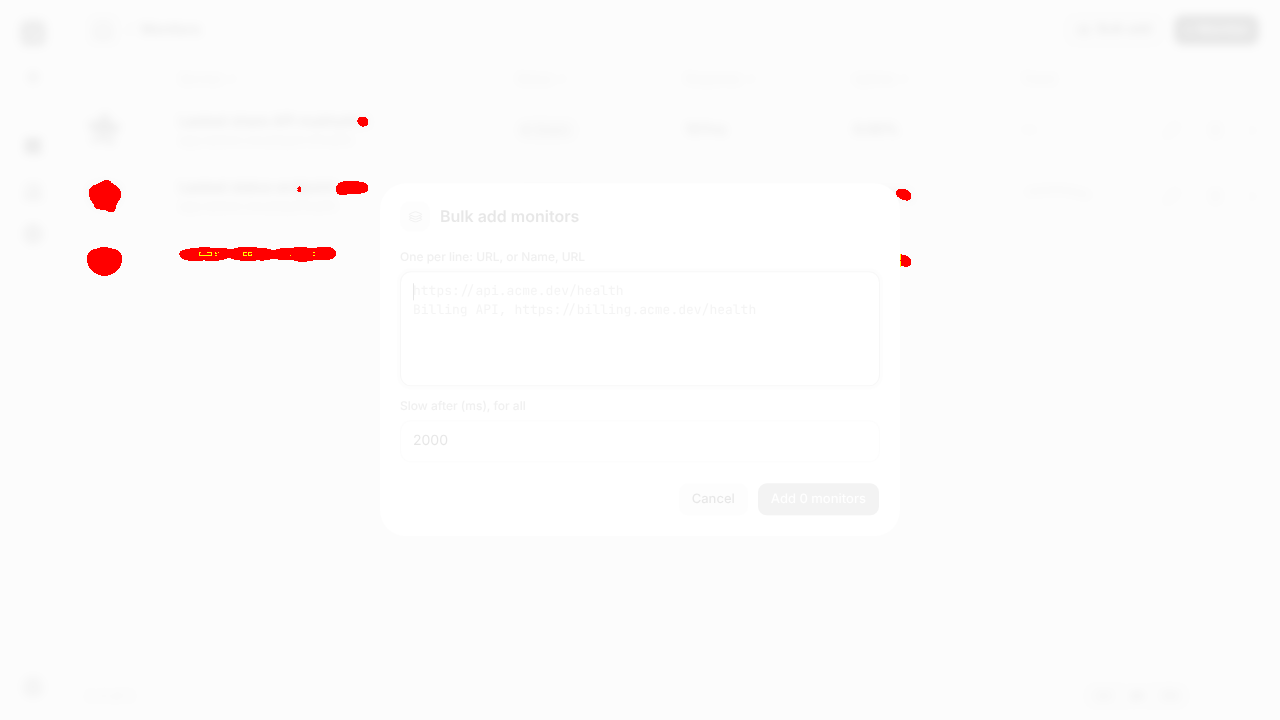
AI-generatedWe signed in to Watchlings and created a real HTTP monitor end to end: named the endpoint, set a 1200ms slow-after threshold, picked a watchling to care about it, and watched the first check land. It correctly reported Down with 'expected status 200, got 401' against a protected endpoint, drew the response-time chart and the 90-day uptime strip, and logged the check in Recent checks. We then walked incidents, the public status page and bulk add. The character framing is the differentiator: 'Your watchling gets nervous when responses take longer than this' is a better explanation of a latency threshold than most monitoring products manage in a tooltip.
- The threshold explains itself in character'Your watchling gets nervous when responses take longer than this' under the Slow after field does more work than a help icon, and it makes the number feel like a decision rather than a config value.
- First check lands immediatelyThe monitor was checking within seconds of Create, so the detail page had a real status code, a real response time and a populated chart before we could click away. No empty-state limbo.
- The failure detail is the useful kindRecent checks said 'expected status 200, got 401' rather than just Down. That one line is the difference between 'something is wrong' and 'I know what to fix'.
- The dashboard is empty even once monitors existThe root page renders just the heading with no summary of monitors, uptime or recent incidents, so the first thing a returning user sees says nothing. Even a count and the worst-performing monitor would earn that screen.
- Three critical accessibility violationsOur axe pass scored 79 with three critical issues. The watchling picker is a row of name-only buttons with no group label and no selected state announced, which is the likeliest culprit.
- Delete / Pause on the monitor detail·Both are visible and we screenshot them, but we never click destructive controls on a founder's live product.
8 visual changes
















Share this run
Proof your app is not AI slop
This test was built for watchlings.vercel.app — claim it free
One click copies the test and baseline screenshots into your own Lastest workspace. Re-run on every deploy and catch regressions before your users do — free, no card required.